| Corcoran Technical Trading Patterns for March 1 |
| By Clive Corcoran |
Published
03/1/2007
|
Stocks
|
Unrated
|
|
|
|
Corcoran Technical Trading Patterns for March 1
Following Tuesday's sell-off there was an anticipation that weakness would continue in yesterday's session. Asian markets, except Shanghai, showed continuing, but not dramatic weakness and in Europe the FTSE 100 had another day of prolonged selling. The US market produced a small bounce and there was wide relief that the almost panic selling from Tuesday afternoon had abated. Reassuring remarks from Bernanke and plenty of comments to the effect that the fundamentals had not changed etc. are to be expected and some could be excused for wondering what all the fuss was about.
Was Tuesday just an aberration - a "lite" crash - the kind of thing that can happen from time to time and without serious consequences? We will not take the bait and stick our neck out with any hard edged forecast but we do take it more seriously than some commentators appear to. The fact that the NYSE systems were overwhelmed by the order flow and that the DJIA dropped precipitously in the mid afternoon on Tuesday is also a concern in its own right. As we discuss in Long/Short Market Dynamics the workflow of markets is changing and the way that large funds make rapid allocation decisions can cause price cliffs to arise no matter how good the underlying technology is. This happened in May 2006 and our suspicion is that it will arise more frequently in the future,
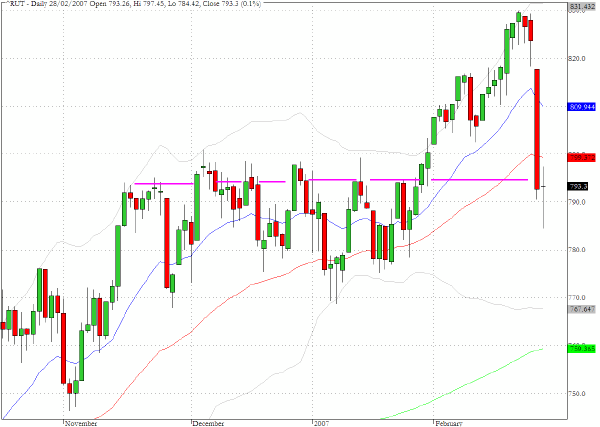
As for the near term direction of the broad indices we suggest, as we did yesterday, keeping a close eye on the Russell 2000 (^RUT) as, we believe, this will be the place where a real change in the underlying dynamics and sentiment will first manifest themselves.
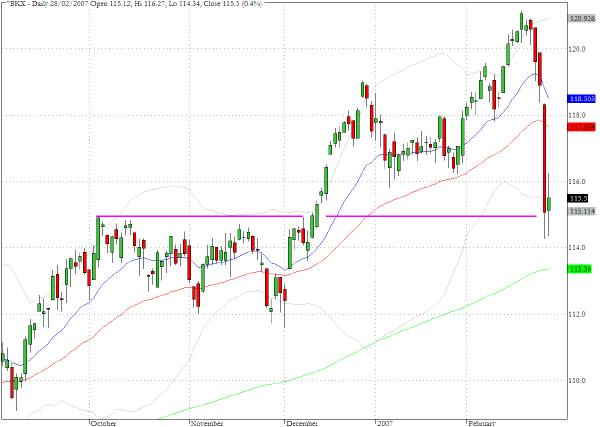
We have featured the chart for the broker/dealer index several times recently as this is the sector where the footprint of the hedge funds is most likely to show itself. Apart from the fact that proprietary trading desks at the big investment banks employ strategies very similar to those used by many hedge funds, most hedge funds use the investment banks as their prime brokers and if there are risks to the capital of the hedge funds this has the potential to negatively impact the capital of their brokers.
The banking index (^BKX) tracks the big money center banks which are somewhat less exposed to the alternative asset management sector but with the growing interdependence of most financial institutions arising from the nature of the derivatives markets, the possibility of a financial crunch will become evident in the banking index as well. The index has now dropped back almost to the pre-breakout level from early December and it will be useful to monitor the quality of the expected attempt to regain a positive posture.
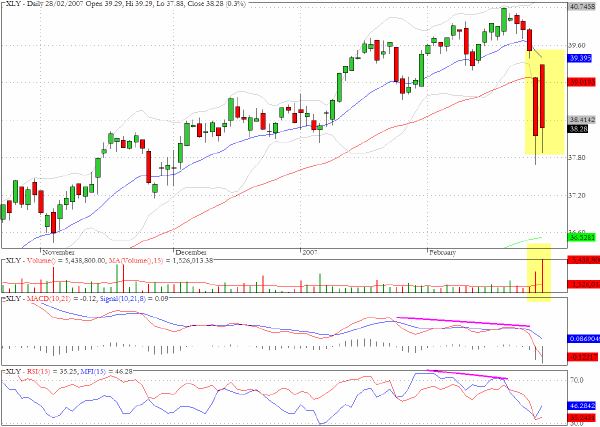
The exchange traded fund that represents the consumer discretionary sector, XLY, shows a remarkable intraday negative reversal yesterday and the volume was even higher than Tuesday’s. The sector gapped up on the open but then sold off for the rest of the session. Negative momentum and money flow characteristics are also evident on the chart.
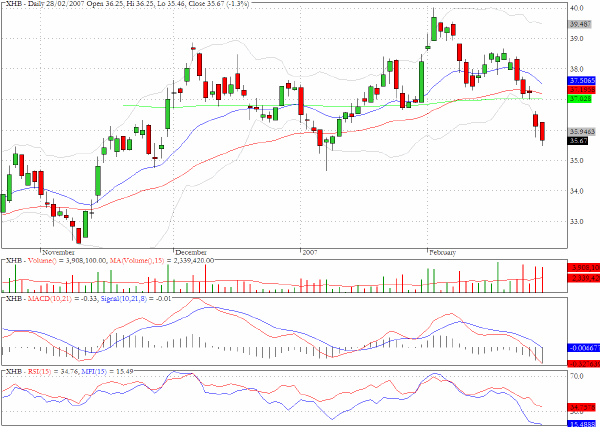
The ETF for the homebuilders, XHB, continued to erode yesterday and closed below all three moving averages with no obvious chart support level in sight.
TRADE OPPORTUNITIES/SETUPS FOR THURSDAY MARCH 1, 2007
The patterns identified below should be considered as indicative of eventual price direction in forthcoming trading sessions. None of these setups should be seen as specifically opportune for the current trading session.
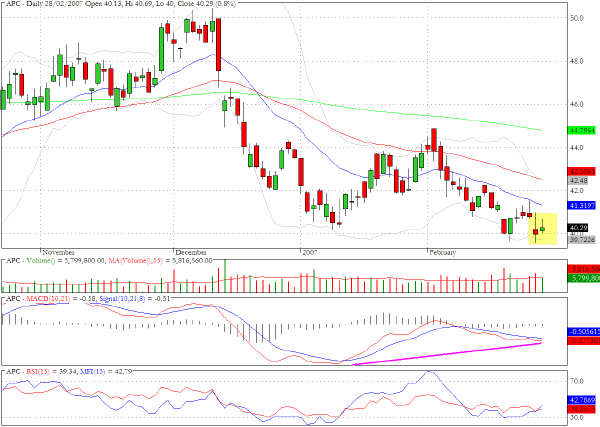
Anadarko Petroleum (APC) shows positive divergences.
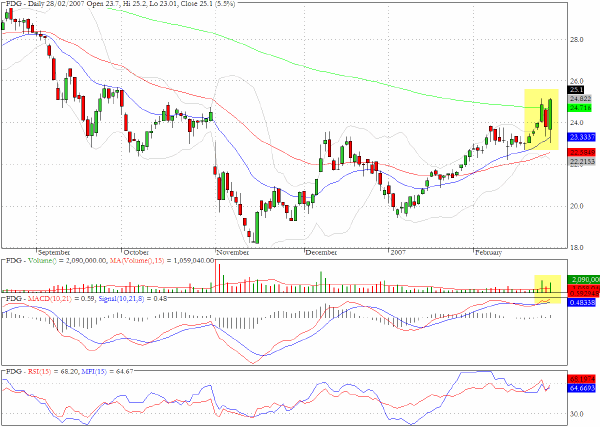
We mentioned Fording (FDG) in our weekend commentary and commented on the bullish behavior but the 200-day EMA hurdle that needed to be crossed. Tuesday's sell-off was modest and on reduced volume and yesterday's response was a resumption of the bullish behavior on higher volume.
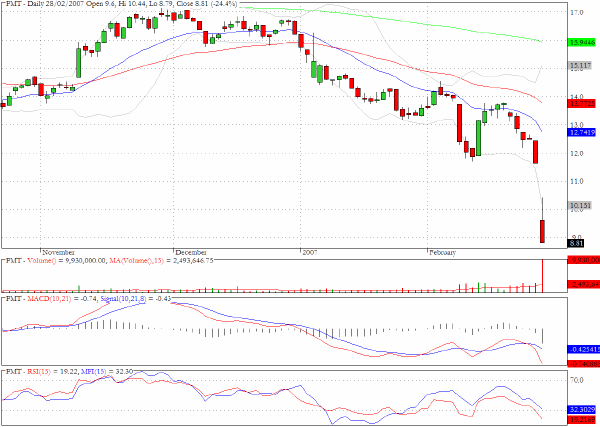
Fremont General (FMT) shows that the sub-prime shakeout is still producing dramatic collapses.
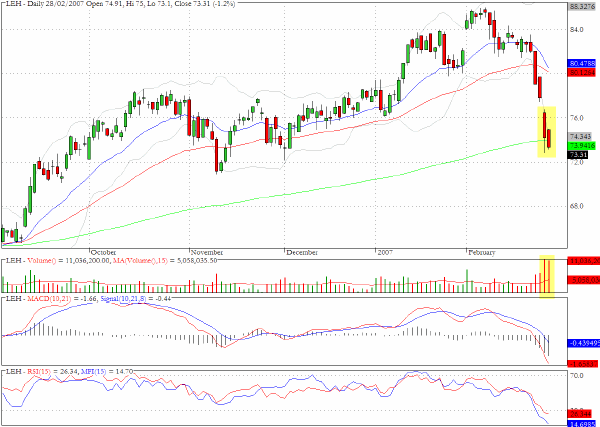
The chart for Lehman Brothers (LEH) shows that despite some minor recoveries from some of the investment banks yesterday LEH still seems to be under pressure and is positioned at a fairly important inflection point.
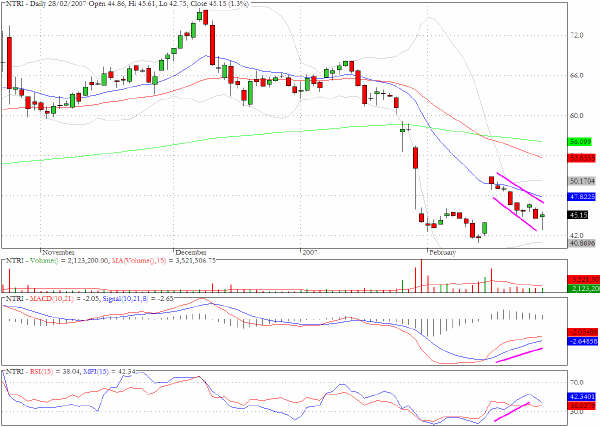
Nutrisystem (NTRI) has one of the more positive looking formations from our overnight scanning of the daily charts.
Clive Corcoran is the publisher of TradeWithForm.com, which provides daily analysis and commentary on the US stock market. He specializes in market neutral investing and and is currently working on a book about the benefits of trading with long/short strategies, which is scheduled for publication later this year.
Disclaimer
The purpose of this article is to offer you the chance to review the trading methodology, risk reduction strategies and portfolio construction techniques described at tradewithform.com. There is no guarantee that the trading strategies advocated will be profitable. Moreover, there is a risk that following these strategies will lead to loss of capital. Past results are no guarante of future results. Trading stocks and CFD's can yield large rewards, but also has large potential risks. Trading with leverage can be especially risky. You should be fully aware of the risks of trading in the capital markets. You are strongly advised not to trade with capital.
|