|
A Mid-Week Look at the Markets
For obvious reasons, today's mid-week update is going to be of a little different tone and focus. We delayed it a day just so we could incorporate a little more data into the analysis -- not that it's helped considerably so far. The bleeding stopped briefly on Tuesday, but another freefall this morning sent the indices down again, though not by quite as much as Tuesdays' carnage.
As you'll sense - or read explicitly - the sharp fall and uncanny makes it much more difficult to get a grip on what's likely to be next, as there is no relevant comparison. However, we've got some pretty strong opinions on what we think we'll all need to look for. We'll focus primarily on this items today, though we'll try and make something of a market call as well.
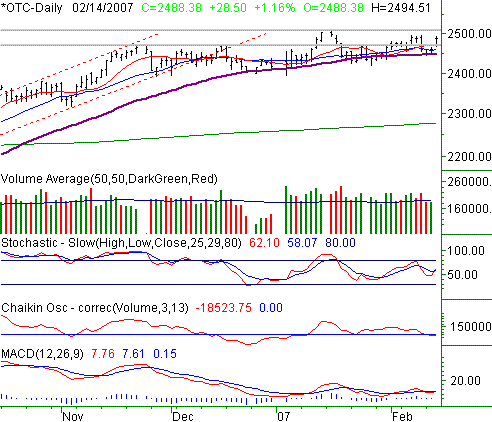
NASDAQ Commentary
Had the NASDAQ fallen from 2530 to the current reading of 2399 over the course of say a couple of weeks, we would have thought nothing of it - we were due for a correction, and that pullback would be of the garden variety. Moreover, that 5.2% slide still may not have been a sufficient correction to really let the market get reset, meaning we could see even further losses until a bottom was hit.
The problem arises when you fall 130 point in three days time. Not only is that far from being a gentle, rolling downtrend, it also negates any decent use of your technical indicators. They all look bearish by that point.
The tools we're left with are the sentiment tool - the ones that measure fear or complacent, or more importantly, the ones that are likely to spot a bottom (or not). Specifically, we're talking about the CBOE NASDAQ Volatility Index, or VXN. As you can see on the chart, it shot through the upper Bollinger band on Tuesday. The market reversal signal is likely to be when the VXN starts to head lower. The obvious problem. How will we know when that is? Our best guess is when we see a close back under that upper band line. It's at 21.52 right now, while the VXN is at 22.60. If we can close back under that line, that might be the bottom. However, we also should remind you the VXN chart now looks quite similar to the one we say in front of last (early) May's selloff. The VXN surged and paused several times during that terrible month, but never actually started to head lower. And even in late May when it finally started to fall back, it still wasn't the end of the market's big correction. Don't assume this time has to be any different.
In the meantime, a lot of damage has been done. This is the first time in months anybody had to deal with real bearishness, and it wasn't well received. Today's gap lower is a reminder of how sensitive traders are right now - they'll sell at the drop of a hat. Not good for the bulls.
Truth be told, it still may be premature to make any kind of firm call. We'd rather get to the 200 day average line (green) and just 'get it over with'. Unfortunately, this rapid devaluation - especially after today - might just look too inviting to the bargain hunters. They already stepped in right after the open, so they're out there. We'll see how it plays out today and tomorrow.
NASDAQ Chart

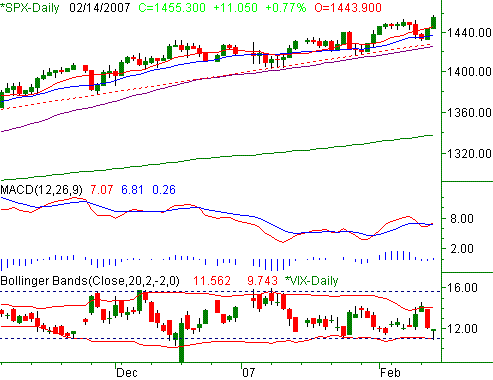
S&P 500 Commentary
Everything we said about the NASDAQ's VXN? It applies to the CBOE S&P 500 Volatility Index as well. We'll say an upside reversal is nigh when it closes back under that upper band line at 16.28 (it's at 16.88 right now). However, that's really not the only thing we'd like to see happen. We'd also like to see a close above yesterday's high of 1415.90 before telling the bulls to get back in the saddle and that's just for starters.
The damage - on a purely visual basis - looks pretty stark on this chart. We're under the 50 day line (purple) for the first time since July of last year, and it's not resting will with the market so far. That plunge inflicted a lot of other technical damage too, like a clear break under long-term support (red, dashed).
In any case, there are two basic schools of thought here. One camp thinks that things have been so incredibly bad this week that any required shake-up has already happened, and we can get back to bullish business. The other camp feels this is just the beginning, as we were long overdue for a correction - a correction that was staved of by an incredible reign of complacency.
We know that's not a ground-breaking revelation. As for which side of then fence we're on....we're still on the fence. Today's unexpected gap lower is one reason why, though it could have just as easily been the other way around.
That said, we're not assuming we'll see the VIX reverse and head lower gain as it as so many times the last few months. Remember, the sub-12 readings were the oddity. All this recent spike did was bring the VIX back, or at least closer to, it's long-term norms. There is a possibility that the complacency problem was solved on a semi-permanent basis, with the VIX just taking care of that in one fell swoop.
As we said with the NASDAQ, there's not quite enough clarity to say what's likely to be in store.
S&P 500 Chart

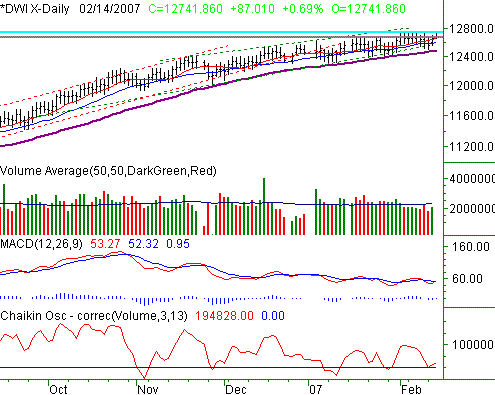
Dow Jones Industrials Commentary
Nothing really new to add for the Dow - its chart looks very much like the S&P 500's in that the degree of damage is highlighted by the fact that we haven't' seen anything this ugly in months.
Dow Jones Industrials Chart

Final Thoughts
It's easy to be a bear when stocks are falling, and easy to be a bull when stocks are rising. The real test - and when the most money is won or lost - is in trading against the short-term trend. With that in mind, we would caution against getting too giddy if we see a little upside action - being oversold makes any upside movement a little more likely. Higher highs would be significant, but really only a cross back above the 50 day averages (in all cases, the purple line) would soothe investors' wounds effectively. If we make it back up there and then stall again, then we may well see round 2 of the selling. Or, lows under today's low could spark round 2, or maybe just extend round 1. Statistically speaking, we're still due for more downside if this is indeed going to be a normal correction. Of course, what's normal anymore?
Price Headley is the founder and chief analyst of BigTrends.com.
|