| The McMillan Options Strategist Weekly |
| By Lawrence G. McMillan |
Published
03/2/2007
|
Options
|
Unrated
|
|
|
|
The McMillan Options Strategist Weekly
The landscape has changed dramatically in the last week: volatility has increased substantially and weeks, if not months, of gains in most stocks have been wiped out. The question now becomes when and where will this decline end? Since our technical indicators were instrumental in warning us of this decline, we are of course going to rely on them to aid us in answering that question.
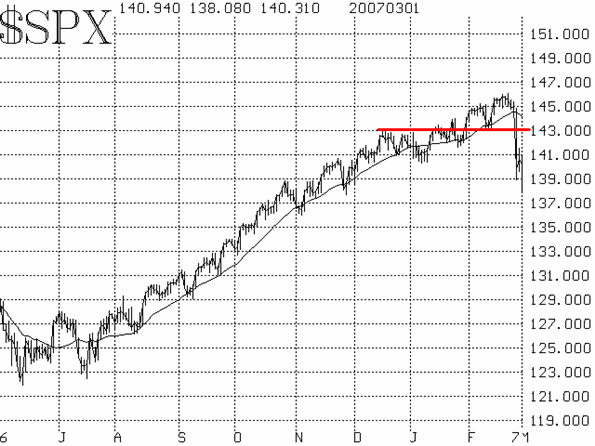
We were looking for a selloff -- in fact, a "sharp, but short-lived correction," to quote our comments last week. But we didn't know it would be this sharp, of course. $SPX has broken most of the major support levels it had established in its inexorable, stair-step rise over the past several months. Specifically, $SPX wiped out 3 months worth of gains in one day -- trading at the same price it had on December 1, 2006. For $SPX, the 1430 level is now resistance, much as it was during December and January (see Figure 1). Until that level is overcome, the $SPX chart should be interpreted with a bearish bias. On a more positive note, Thursday's retest of the lows seems to have held, and that is a constructive sign.

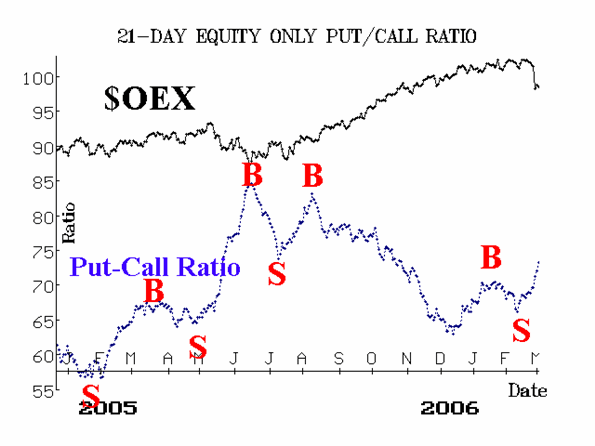
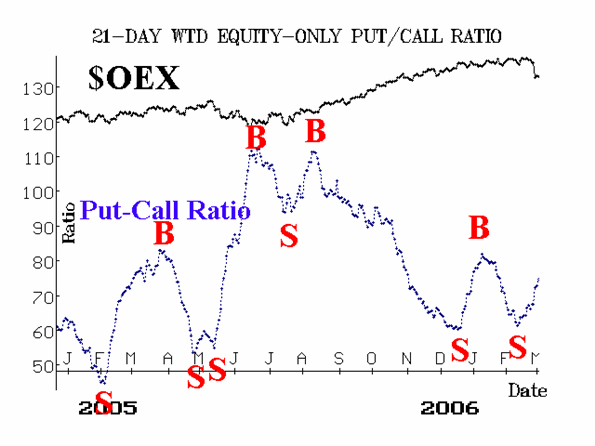
The equity-only put-call ratios were prescient in warning of a decline by rolling over to sell signals in late January. Yes, they were a bit premature, but they resolutely remained on those sell signals ever since -- and they show no sign of turning bullish yet. Figures 2 and 3 show that are continuing to rise rather strongly as (too late) lots of traders rush to buy puts now. Eventually, those put buyers will overdo things, and the ratios will roll over and turn downward. Only then will they turn bullish, but that does not appear to be something that will happen soon.


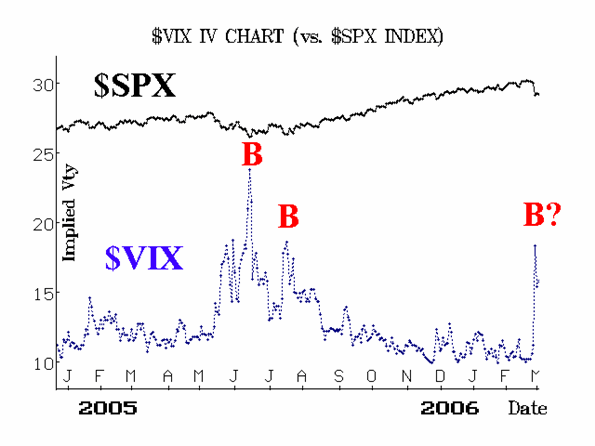
Market breadth (advances minus declines) had been running at very overbought levels for quite some time. That is no longer the case. Now, breadths has generated sell signals. We are looking for breadth to get oversold -- something it hasn't done for months -- before generating buy signals. That, too, is something that isn't going to happen overnight. Finally, there is the indicator that was perhaps most instrumental in our expectation of a correction: the volatility index, $VIX. It had traded below 10, and history showed that a sharp correction normally takes place after that. Now, $VIX has spiked upward. A buy signal occurs when $VIX makes a spike peak on its chart (see Figure 4). We would turn short-term bullish if $VIX generates a buy signal.

In summary, the decline was sharper than nearly anyone had expected. It was exacerbated, of course, by the fact that the bulls (or pigs, if you prefer) just kept pumping money into the market for so long, without giving it a chance to correct. Eventually, a little trigger like the Chinese stock market caused all the lemmings to try to get out the exit at once, and, in doing so, they nearly brought the house down. There has been major damage done to many accounts and buying is no longer on many of their minds (I cringed at the money manager being interviewed on CNBC, who was remaining bullish, but when asked what he was buying, answered "Nothing. I was -- and am -- 100% invested"). That may be the case for many of these managers: they are more likely to be sellers on rallies than to be buyers.
Lawrence G. McMillan is the author of two best selling books on options, including Options as a Strategic Investment, recognized as essential resources for any serious option trader's library.
|