|
A Mid-Week Look at the Markets
NASDAQ Commentary
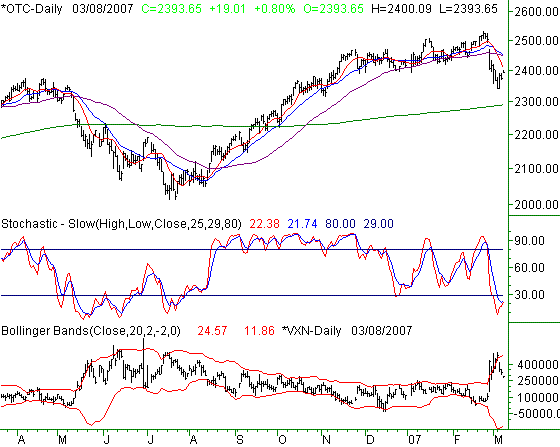
The NASDAQ composite closed at 2374.64 on Wednesday after losing 0.44 percent, or 10.5 points. The index was never really in the black on Wednesday. unlike the other two indices. But still, for the week, we find the NASDAQ composite is ahead by 0.28 percent, or 6.64 points. However, that hardly unwinds all the bigger picture damage taken for most of last week and Monday of this week.
Of course, today's strength should help the bullish effort. But, a quick observation is we've seen several instances over the last few days where during the last half-hour of trading, gains were turned into losses, or small losses were turned into big ones. It's a subtle hint that nobody wants to "take them home." So, we're not out of the woods yet. Let's see how we close out this week before we get too excited.
In fact, in many regards a rebound was inevitable. We were statistically oversold -- as statistically oversold as we've been since July of last year. Obviously, you can make the bullish argument out of that fact. However, the "oversold" then was a different kind of "oversold" than the kind we have now. We were at the end of a pretty nasty correction at that point. This "oversold" came just a few days after we reached multi-year highs -- not quite the same.
As for the NASDAQ, we're under the 50-day moving average for the first time in months, and that's not insignificant.
So, we're not necessarily going to read a lot into today's strength just yet. We're still under the 10-day moving average line and this morning's gap is just begging to be closed by some selling.
We're going to set our resistance line at 2455. That's where the 20- and 50-day line are currently resting. As far as support is concerned, we have no choice but to peg it at 2340. That was Monday's low, and Tuesday's low. The combination of those two bars is also a strong signal of a bullish reversal -- one of the best bullish arguments right now. In the meantime, be patient. How we close out this week is going to be critical.
NASDAQ Chart

S&P 500 Commentary
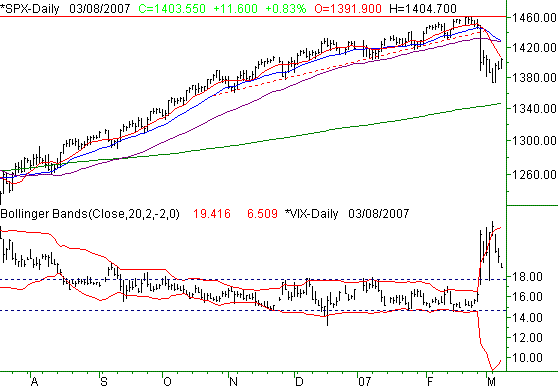
The S&P 500 managed to turn a gain into a loss by the time we heard Wednesday's closing bell. For the day it closed lower by 3.45 points, losing 0.25 percent to end the session at 1391.95. For the week though, the large cap index is still ahead by 4.8 points, or 0.35 percent, thanks to Tuesday's huge rally. Thursday's rally is also a nice boost.
The major question mark for this chart continues to be the volatility index (VIX). It spiked to a high of 20.41 with Monday's major market pullback. That's roughly twice as high as it was just a week earlier, and certainly pushes the limit on how far the VIX can feasibly move in such a short period of time. Just because we hit a top for the time being does not inherently mean the market has hit his final bottom. We saw the VIX ebb and flow for several weeks in the middle of last year, but many of the pullbacks were remet with equally strong rebounds, driving the market lower each time.
So, we'll continue to watch the VIX - in particular for upside pressure. If we do happen to see a higher high or higher close for the VIX coincide with a lower low or lower close for the S&P 500, that may well be a sign that the bears have regrouped. But still, only a new under 1374 would really flip us all the way into the bearish camp. That was the low from both Monday and Tuesday.
The 10-day moving average line (red) at 1405 is under attack as resistance today. That may be the rollover point for this recent strength, but if we close above that line, we'd say the bullish odds have significantly improved. However, today isn't over yet.
S&P 500 Chart

Dow Jones Industrials Commentary
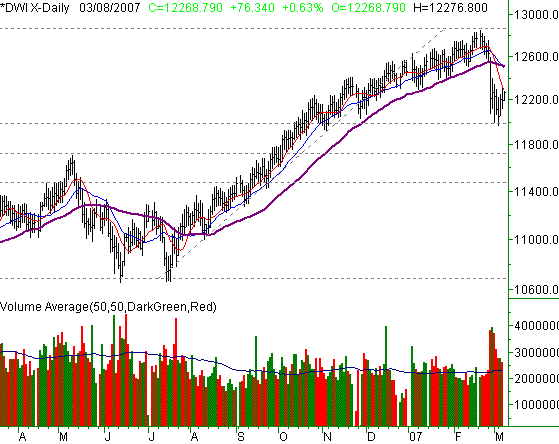
The Dow Jones industrial average only lost 15.14 points yesterday, or 0.12 percent. The close of 12,192.45 is still 78.35 points above last week's close, so the Dow - on a weekly basis - is technically leading the pack. That, however, doesn't necessarily mean this chart looks any more bullish than any other chart does.
In this sense, were particularly interested in the Dow's chart right now because we're probably going to see some sort of inflection point today (Thursday). Why? Because the 10-day moving average line (red) is likely to be tested as resistance. It's currently at 12,325, versus yesterday's high of 12,315.18. If it fails to keep the rally in check that might - might - mean that the worst is over. But still, we need a lot more proof than that to jump in blindly and bullishly.
We're thinking at least a move above 12,523 would be a smarter indication of the uptrend's renewal. That's a bit conservative we know, but in an environment like this, you really can't afford to assume anything.
On the flip side, the bearish argument can actually be made using the same moving average lines. For the first time since July, the 10- and 20-day moving average lines are under the 50-day moving average (purple). That's not likely to be an easy problem to just undo.
On today's chart of the Dow Jones Industrial Average, were adding something we normally don't look at: Fibonacci retracement levels. The premise behind this kind of analysis is simply setting a likely degree of pullback based on the distance between a low and a high. (We're using his July's low of 10,658, while the high is the recent peak at 12,845.) If the Fibonacci-based prediction is true, we're likely to see dips from the high hit a bottom at 38.2 percent, 50 percent, or 61.8 percent under the recent high. All five of those lines are plotted on our chart (gray, dashed).
Interestingly, the first likely retracement level of 38.2 percent is at 11,945. Monday's low was 11,973, which was close enough for us to say there's something to this kind of retracement analysis.
Now, just because we found some support there and temporarily stopped the downtrend doesn't exactly mean the worst is over. It just means the first wave is likely to be over. We still may retest the 50 percent level as well as the 61.8 percent level at 11,431. In fact, that lower line is where we're going to place our official support level for the time being. Note that reaching the low would pull the Dow Jones Industrial Average well under the 200-day moving average line (green).
In the meantime, it looks like the market is up pretty firmly today -- perhaps the first crack at getting back above some resistance levels. But like we said above, from a momentum perspective, we really need to get above 12,516 to start a meaningful rebound.
Dow Jones Industrials Chart

Price Headley is the founder and chief analyst of BigTrends.com.
|