|
Weekly Outlook in the Stock Market
NASDAQ Commentary
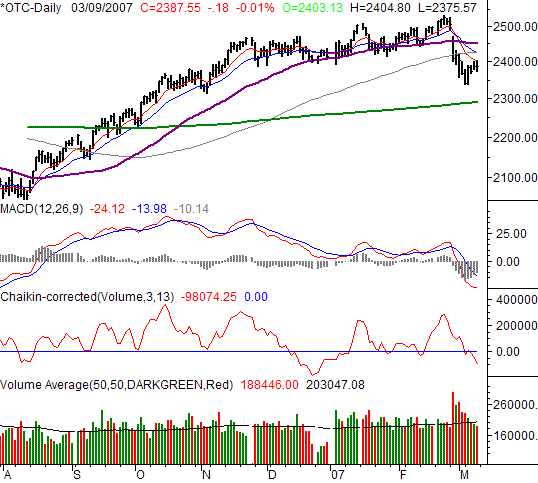
The NASDAQ Composite was the only index to end in the red on Friday, by losing 0.18 points, or 0.01%. That meant a weekly close of 2387.55. But still, for the week the composite regained 19.55 points, or 0.83%. Not bad, but as you'll read below, the other two major indices did considerably better. Were this rebound for real, theoretically the NASDAQ should be leading it. It's not. Therein lies the concern, so we don't think the bulls should get too excited just yet.
On all of our charts this week we backed out to take a longer-term view, just to add some perspective on the last couple of weeks. In looking at the NASDAQ's chart it's clear we haven't undone the damage taken from two weeks ago. Yes we applaud last week, but frankly it was inevitable. We had plunged 5.85% the week before. Anything will bounce after falling that hard.
As it stands right now, the NASDAQ composite failed to even get back above its 10-day moving average line on Thursday and Friday. This will be an absolute minimum hurdle to get over if there's going to be a bounce in the near future. But even then, there's a ton of tangled resistance between 2420 and 2450, where the 100-day, the 20-day, and the 50-day moving average lines are all resting. As far as we're concerned, only a break above 2450 would be a sure sign that the bulls were back in charge.
In the meantime, any move under 2340 is likely to set up another wave of selling.
On our chart, we can see the 200-day moving average line in green. We don't necessarily expect this line to play a support role is 2340 does indeed break as support.
NASDAQ Chart - Daily

S&P 500 Commentary
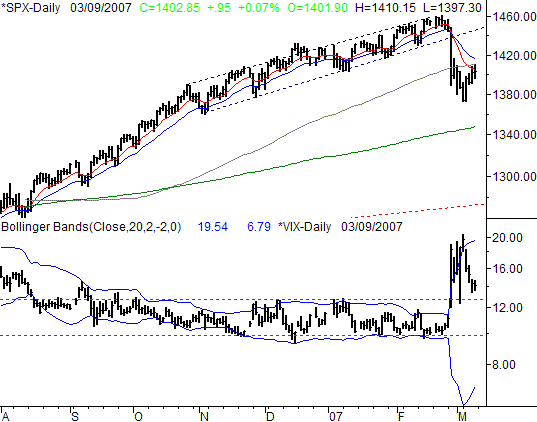
On Friday, the S&P 500 gained only 0.95 points (+ 0.07%) to end this session that 1402.85. That still meant a pretty respectable rebound for the week however, as the index gained 15.7 points, or 1.13%. From a short-term momentum perspective, this may seem like a pretty good recovery effort. However, we're hardly out of the woods yet.
The S&P 500 managed to get back above its 10 day moving average line late last week. However it struggled with its 50-day line on Friday. So, there's still some serious work that needs to be done if there rebound is going to be made here. We'd say a move above the 20-day line at 1418 would be a good place to start.
On the flip side, if we see another trade under 1374 where we bottomed on Monday, that may spark round two of a selloff.
On our chart you'll see a small segment of a line around 1270. That's a very long-term support line that actually goes back to the year 2005. Yet, it's on our radar again. Don't forget that the prior 7 months worth of bullishness was a statistical anomaly. We haven't had a correction until now, but the correction we owe the market really could drive the S&P 500 back down to that level, in a worst-case scenario. We don't want to the sound the alarm just yet, because we probably need a few triggers to make it happen (such as the move under 1374). But, don't rule the possibility out.
In the meantime, the VIX remains an enigma. What we do know for the time being is that the VIX stopped falling on Friday, after falling over the previous three days in what was a corrective move of a spike the week earlier. Maybe this is the pivot point, or maybe was just a break. There's an awfully big gap between 11 and 12 that could be calling the VIX lower. Or, we also have to wonder if the recent break above 12.5 is a little more permanent. We just can't say right now. Unfortunately, we may not even be able to say this coming week... option expiration is looming, which can skew the VIX reading.
S&P 500 Chart - Daily

Dow Jones Industrial Average Commentary
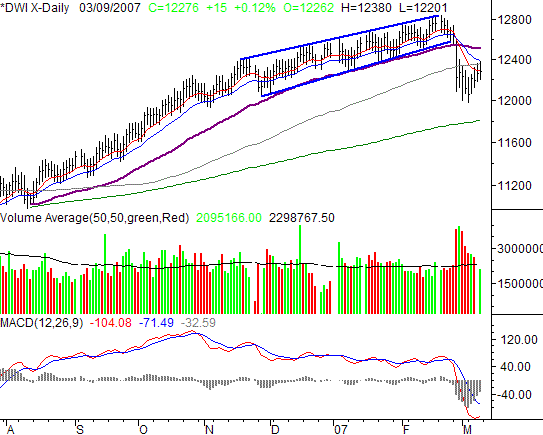
The Dow Jones Industrial Average gained 15 points on Friday (+ 0.12%), and left the blue chip index at 12,276 for the week. And, on a weekly basis, the Dow closed 162 points above the previous Friday's closing level... good for a 1.34% gain. As with the S&P 500, that's respectable, but also a little expected. So far, the Dow Jones industrial average hasn't really tackled any major obstacles.
For the Dow, we can only get back in the bullish camp if the 50-day moving average line at 12,510 is cracked again. So far, the index is struggling with its 10-, 20-, and under-day lines, so there's some pre-work to be done before we even entertain the possibility.
Besides that, there's not really a lot in new to add here. This chart is caught between a rock and our place like the other two are.
Dow Jones Industrial Average Chart - Daily

Price Headley is the founder and chief analyst of BigTrends.com.
|