| Corcoran Technical Trading Patterns for March 12 |
| By Clive Corcoran |
Published
03/12/2007
|
Stocks
|
Unrated
|
|
|
|
Corcoran Technical Trading Patterns for March 12
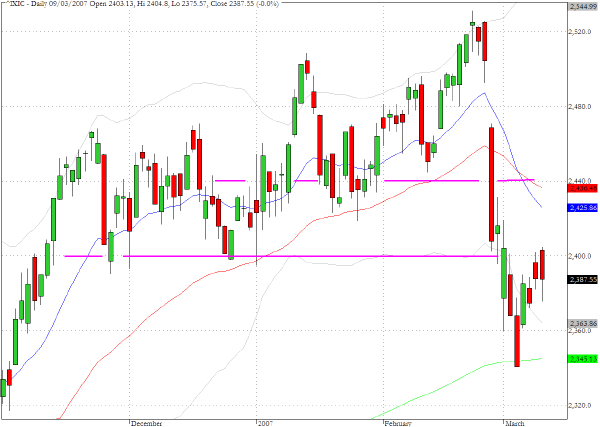
The Nasdaq Composite (^IXIC), met resistance at the 2400 level in Thursday's trading and then retreated. In Friday's trading, with a positive reaction to the employment data, the index gapped on the open above the 2400 level. The early enthusiasm faded and the index pulled back to close at 2387 which was almost an identical close to the one on Thursday.
The chart pattern suggests that the attempts by the bulls to put the troubles of two weeks ago behind us are meeting with some scepticism. For large institutional portfolio managers, unlike index traders, witnessing the dramatic action of February 27 is likely to have caused more timidity and trepidation that will take some time to settle.
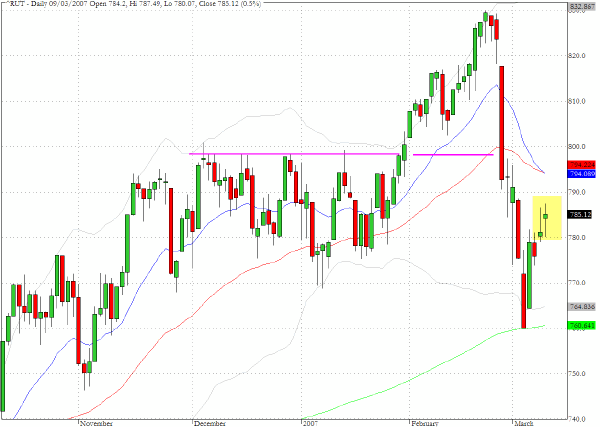
The chart for the Russell 2000 (^RUT) clearly illustrates the rather technical nature of the trading that we have seen over the last two weeks. The sell-off took the index down exactly to the 200 day EMA at which point we have recovered steadily. The index now faces the combination of chart resistance in the vicinity of the 800 level as well as the convergence of the 10- and 50-day EMA's also near that same level.
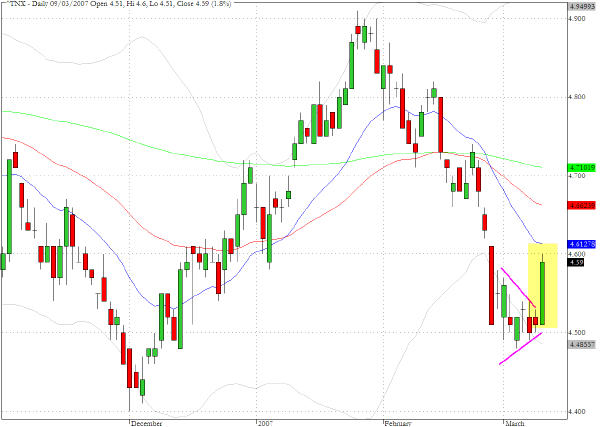
As expected from the triangular pattern that we discussed in Friday’s commentary, the Treasury market found in the employment data the impetus it needed to move out of the tight consolidation pattern that had been in place for several sessions. The yield on the ten year note (^TNX) covered nine basis points during Friday’s session and ended up close to its high yield for the day at 4.6%.
The perception in the market is that the recent concerns about an impending recession had been overblown. Also the easing of the pressure on equities has removed the other supporting element for yields - "the flight to quality" - and yields appear to have resisted the temptation to retest the 4.4% level which is a fundamental multi-year support level.
TRADE OPPORTUNITIES/SETUPS FOR MONDAY MARCH 12, 2007
The patterns identified below should be considered as indicative of eventual price direction in forthcoming trading sessions. None of these setups should be seen as specifically opportune for the current trading session.
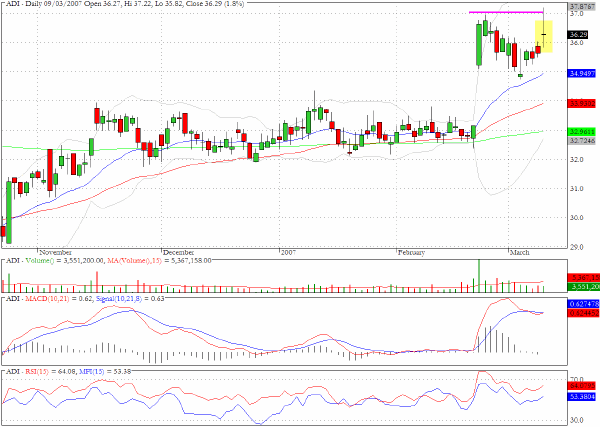
The chart for Analog Devices (ADI) presents a possible flag failure pattern. The pullback from the price surge from February 22 on very heavy volume produced the potential breakout resurgence in Friday's trading but the doji pattern, the modest volume and the clear resistance at the top of the flagpole raises the possibility that the flag interpretation is about to unravel. We would suggest that the stock be monitored today for possible weakness.
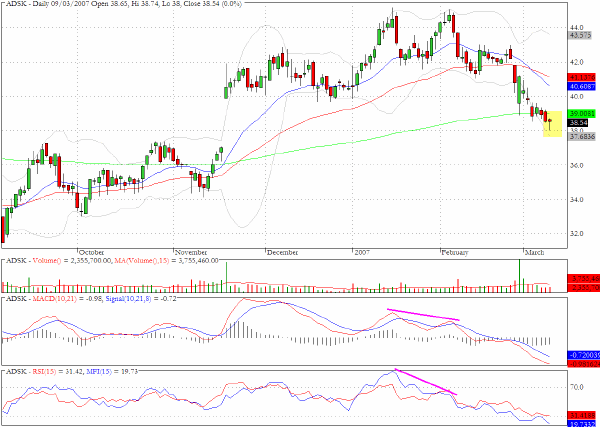
The chart for Autodesk (ADSK) shows that the price attrition has continued since the late February sell-off and with the close below the 200-day EMA there is now the possibility that the mid November gap might be filled. As the chart reveals there had been negative divergences during January and February that could have alerted us to potential weakness.
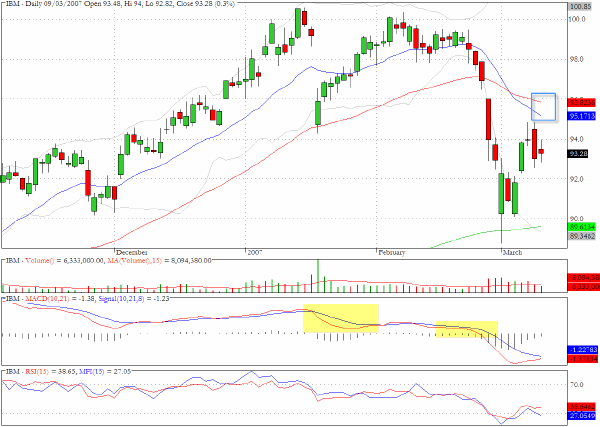
We have been looking for patterns in our daily scans of individual stocks that show some variance to the formations that simply reflect the influence of the overall market. IBM shows a lower high pattern in early February following the large gap down in January and the 50-day EMA should provide strong overhead resistance at the $96 level.
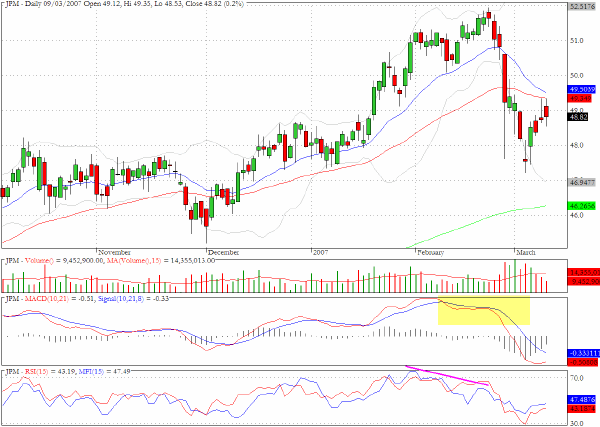
The chart for JP Morgan (JPM) also represents a potentially weaker pattern than the standard template for the overall market during the last few weeks. The coincidence of the short term moving averages just above Friday's close could present an inflection point.
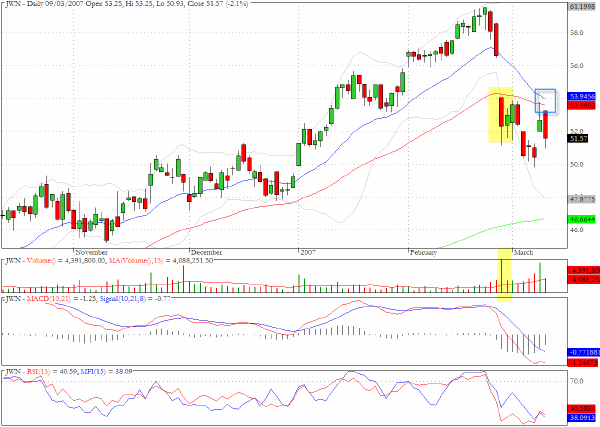
Similar reasoning to the one we proposed in the previous two charts also could be applied to the chart for Nordstrom (JWN). The large gap down on February 27th on very heavy volume highlights the vulnerability of the recent retracement pattern.
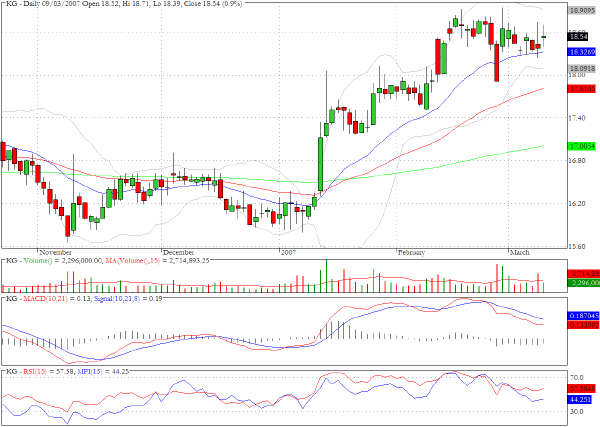
The chart for King Pharmaceuticals (KG) is populated with many recent shooting star formations and Friday's inside doji pattern is often a precursor to a range expansion move.
Clive Corcoran is the publisher of TradeWithForm.com, which provides daily analysis and commentary on the US stock market. He specializes in market neutral investing and and is currently working on a book about the benefits of trading with long/short strategies, which is scheduled for publication later this year.
Disclaimer
The purpose of this article is to offer you the chance to review the trading methodology, risk reduction strategies and portfolio construction techniques described at tradewithform.com. There is no guarantee that the trading strategies advocated will be profitable. Moreover, there is a risk that following these strategies will lead to loss of capital. Past results are no guarante of future results. Trading stocks and CFD's can yield large rewards, but also has large potential risks. Trading with leverage can be especially risky. You should be fully aware of the risks of trading in the capital markets. You are strongly advised not to trade with capital.
|