| Sector Spotlight on Utilities |
| By Price Headley |
Published
03/12/2007
|
Stocks
|
Unrated
|
|
|
|
Sector Spotlight on Utilities
While most other sectors seemed to be getting shaken as well as stirred, we've actually seen one segment relatively undaunted by the recent somersault performed by the market. Might there be an important message in that feat? We think so.
The utilities stocks weren't completely immune to the up-and-down we've all been through the last couple of weeks. However, they were quite shielded from it.
For the sake of comparison, just a few days after the S&P 500 ht a new multi-year high of 1461.55 on February 22, the index fell to a low of 1373.95 - a swing of just under 6.0%. Since then, the market has managed to regain 1.6% by moving back up to 1402.85.
The Dow Jones Utility Index, on the other hand, hit a high of 483.34 on the 23rd. Though we saw a bizarre peak with a ridiculous gap on the 26th, had it not been for the TXU surge (buyout news), we probably wouldn't' have seen it. So for all intents and purposes, we can reasonably use the 23rd's high of 483.34 as the peak. Only a few days later, we'd be trading as low as 467.36 - a 3.3% pullback. The index has moved higher by 1.9% since then. That's better than the market beforehand, and better afterwards.
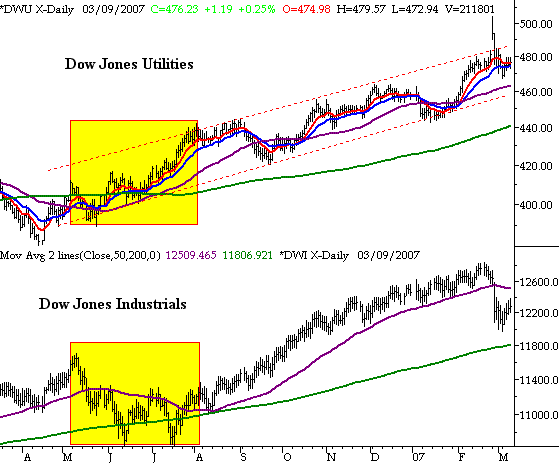
Perhaps more importantly though, the chart has stayed technically firm. Unlike the major market indices, the utilities chart has stayed within its bullish channel - and above support. Though the uptrend wasn't the same beeline made by all the broad market indices, the utility chart isn't running with the same extreme overbought risk most other stocks are (or were, until two weeks ago) either. That's the nature of the beast. Go through a few small corrections, or go through a big one all at once. It appears as if the utilities index did the former.
That's not the only attraction to this chart, however. Go back to the middle of last year (highlighted in yellow). Remember when the market went through that rough spring/summer pullback? The utility stocks not only survived it, but thrived in it. How did that happen? Utilities stocks are defensive. Though we're impressed by the relative strength alone, if the market is headed lower in the near-term - which is a distinct possibility - then this individual sector may be one of the few safe havens for traders.(continued after chart)
Dow Jones Utility Average vs. Dow Jones Industrial Average - Daily

Let's use the bullish channel lines as a support and resistance framework. The upper edge of the zone is at 486 and rising, while the lower edge is at 457 and rising. The Dow Jones Utility Index closed at 476.23 on Friday. We don't expect to see the index break past that resistance, thug we don't think it will fall under support either. If support does break down, a trip all the way down to the 200-day line (green) is a possibility. As for an upside breakout - if it happens - there is no visible ceiling.
By the way, the utilities stocks - by their virtue of performing the 'least poorly', are the leading sector over the last month. They are also the second-best performer over the last 52 weeks -- a testament to the power of slow-and-steady progress.
Price Headley is the founder and chief analyst of BigTrends.com.
|