|
A Mid-Week Look at the Market
NASDAQ Commentary
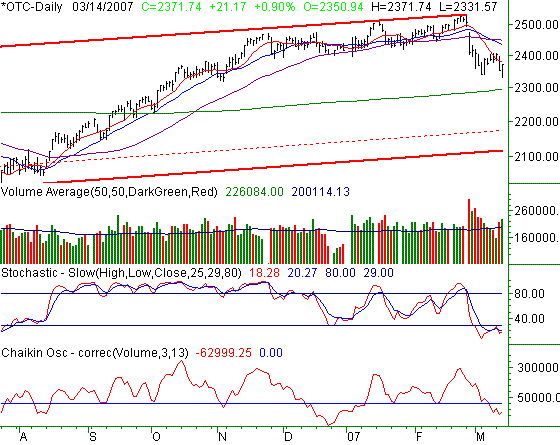
The NASDAQ Composite rallied 21.17 points on Wednesday, gaining 0.90% to end the day at 2371.74. For the week, it's still in the red though, by 0.66% (-15.81 points), thanks to Tuesday's plunge. So, we remain caught between a rock and a hard place.
What's bullish? Yesterday, yesterday's volume, and being stochastically oversold.
After eclipsing the critical 2340 level yesterday and reaching a new low for the year, we figured a fire-sale would be jump-started. But, later in the day, we saw the NASAQ come up off f its low (2331.57) to end well in the black.
And, the day's volume was strong, officially constituting an 'accumulation' day -- the first in a while. It's a glimmer of hope for an upside rebound being made sooner rather than later.
Of course, the sheer size of the pullback on Tuesday, plus from two weeks earlier, has left the composite well oversold - and ripe for a bounce.
That oversold condition is, in our view, the big question mark. It makes any potential ounce likely to be a strong one, but we can get and stay oversold for long periods of time. If this is such a case, then being oversold actually has bearish implications.
For the time being, we've yet to see a stochastic buy signal, where both of the stochastic lines come back above the 20 threshold. So, we're still leaning with the bigger-picture momentum, and thinking like bears. The long-term support and resistance lines (red) are still in play; that's what we're keying off of.
NASDAQ Chart

S&P 500 Commentary
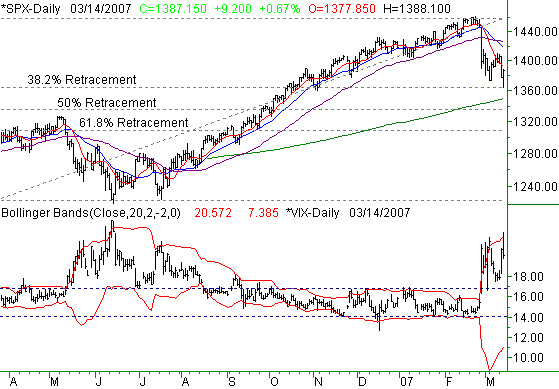
The S&P 500's 0.67% gain on Wednesday left it at 1387.155 -- 9.2 points higher for the day. That's still lower than last week's close though, by 1.12% (-15.7 points). But, perhaps yesterday's mid-day reversal is an omen. If so, then great, but we'd say the bulls need a few more omens before really clinching anything. So far today (Thursday), no dice.
The SPX's low of 1364 on Wednesday almost perfectly touched the important 38.2% retracement line, and then the rally started. Coincidence? Maybe, or maybe not. We'll just say this - it's something we're definitely going to be watching in the near future. Let's reset our support line there (at 1364), since there are now to key reasons to suspect that could be a short-term floor (or maybe even a long-term floor).
Were it not expiration week, the VIX would be far more interesting. But, since unusual option trading may be skewing the VIX level, we have to take it with a grain of salt.
All the same, we still don't want to ignore it. The VIX's tall bar yesterday - with an open and close right at the low - suggests a short-term reversal to the downside. To see it happen right as the upper Bollinger band was reached makes the rollover even more likely.
However, the real test will come next week when we can see the VIX find its groove without expiration week pressures.
In the meantime, the SPX is struggling, unable to even challenge its 10-day average line (red) at 1395. Considering it was already underwater for the month so far, we don't think it's an overly encouraging chart even with yesterday's gains. To that end, we're not particularly counting on the 200-day line (green) at 2294 to play a support role if it's tested.
S&P 500 Chart

Dow Jones Industrials Commentary
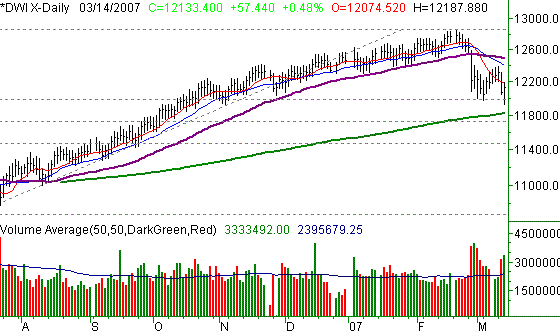
The Dow Jones Industrial Average lagged yesterday, only gaining 0.48% (+57.44 points) to close out at 12,133.40. It's also today's biggest laggard so far. For the week, the Dow is down 1.16%, or 142.92 points...also the week-to-date number of the three indices.
The Dow was the first chart we applied Fibonacci lines to, and they still seem to playing a role. However, that 31.8% retracement line was tested again on Wednesday. It essentially held up, though the index slipped barely under it briefly in the morning. It's at 11,987 right now - the same as last week's low. So, it remains our key support line.
In the meantime, the chart seems to be getting squeezed. The 10-day line (which is acting as resistance) is falling, while the 200 day (green) line is coming into view. It's at 11,822 -- just a few points under yesterday's low of 11,926.
The squeeze, however, may be a good thing. It will force the chart one direction or the other, and get us out of the sideways funk we've been in ever since the big plunge two weeks ago. Be patient until then.
Dow Jones Industrials Chart

Bottom Line
As you read in the TrendWatch today, the 'gravity' effect of expiration week is actually expected to pull the market just a hair higher between now and Friday. On the other hand, that analysis isn't exactly something we'd bet the farm on; we've seen huge exceptions. In fact, all the exceptions seem to be huge.
The one thing we noticed across the board the last few days was volume. To be specific, we've observes the selling volume shrinking, while the buying volume has begun growing. That's a bullish sign of a transition from one mode to another. Just review the volume portion of the NASDAQ's and Dow's chart to see how the red bars are getting shorter, but the green bars are starting to get taller as of yesterday.
The problem is, it's expiration week. All bets are off through Friday, as any buying or selling pressure could be artificial. We think we'll know the market true colors by Tuesday or so. If we had to guess right now though, we'd lean in the bearish side of things. The momentum is still to the downside, and so far, none of the bulls' attacks have gotten any traction.
Price Headley is the founder and chief analyst of BigTrends.com.
|