| The McMillan Options Strategist Weekly |
| By Lawrence G. McMillan |
Published
03/16/2007
|
Options
|
Unrated
|
|
|
|
The McMillan Options Strategist Weekly
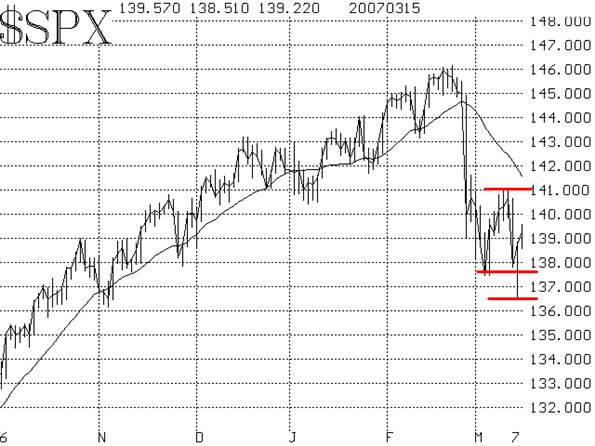
This week, the lows were successfully retested (so far). It is possible that the worst is over for this decline.
As for the $SPX chart, there is clear support and resistance. The support is the 1365-1375 area mentioned above. If there is another retest, we would expect that area to hold -- and perhaps to see some of the other indicators, such as put-call ratios, turn bullish by then as well. Of course, if that support were to fail, then a whole new round of bottom-forming would have to take place. As for the upside, there is resistance on the $SPX chart at 1410. A breakout over that area would be quite bullish. In the past, there have been some bottoms that set up with about the same amount of work as we've seen in this one (July, 1996, for example). As long as $SPX remains within those two levels, we'll retain a neutral opinion regarding the $SPX chart.

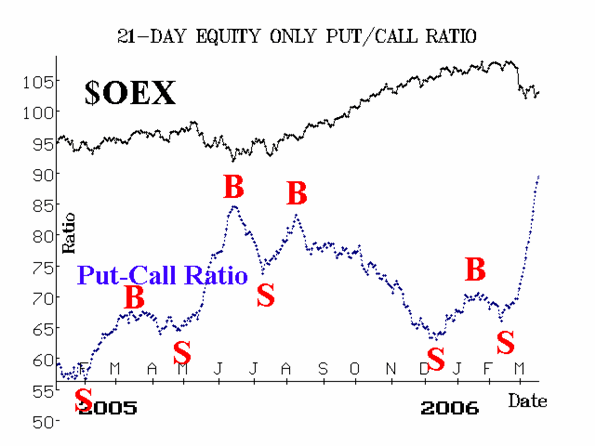
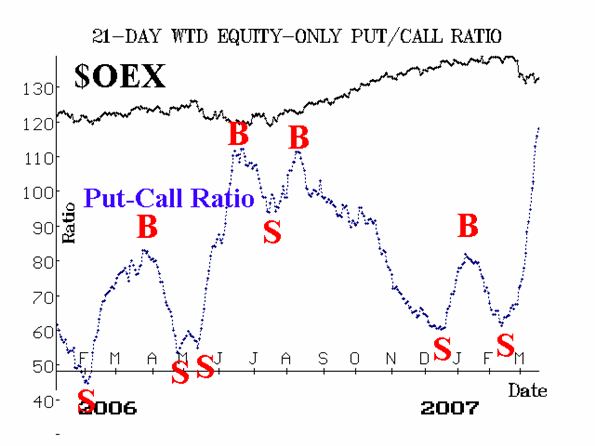
The equity-only put-call ratios continue to race higher, as put volume has been heavy for nearly three weeks -- even on days when the market is up. As a result, both equity-only ratios have correctly remained on sell signals. They are now becoming quite oversold, as they have exceeded the highs set at last summer's bottoms. However, an oversold market can continue to decline. These ratios won't turn bullish until they roll over and begin to trend downward.


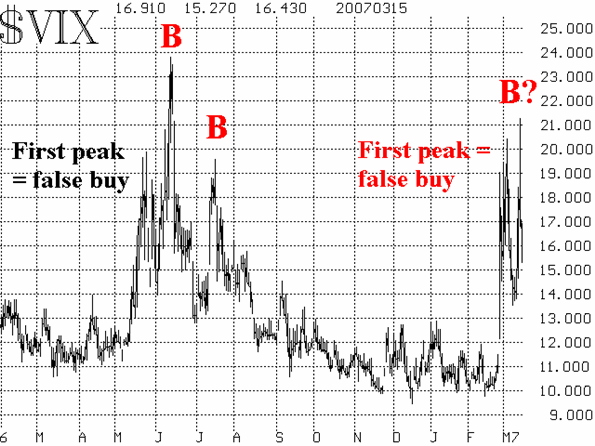
Market breadth has been all over the map, and at extreme levels from day to day. When the market has suffered big declines in price, declining issues swamped advancing issues. In fact, February 27th and March 13th were two of the biggest ratios of declines over advances in history. However, when the market rallies, advances dwarf declines. Finally, the volatility indices have been quite interesting. During Wednesday's drop to new lows, $VIX rose to a new high -- above 21. It has since fallen back quite a bit. A spike peak in $VIX is a buy signal.

In summary, we think there is a good chance that the lows are in, although they may be retested once more. Any sustainable rally will need to have buy signals from the equity-only put-call ratios -- something that has not been forthcoming so far. For now, though, we remain somewhat neutral on the market until more pieces of the puzzle fall into place.
Lawrence G. McMillan is the author of two best selling books on options, including Options as a Strategic Investment, recognized as essential resources for any serious option trader's library.
|