NASDAQ COMMENTARY
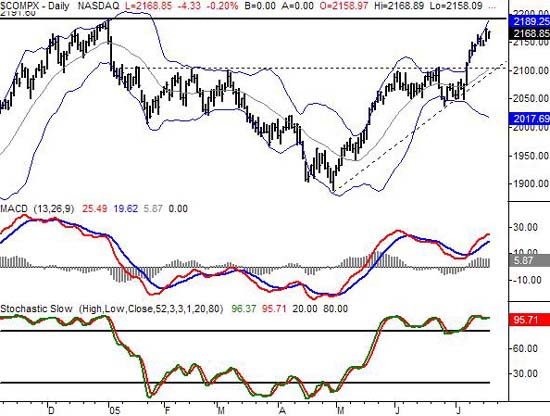
After breaking through the resistance at 2100 two Friday's ago, the NASDAQ did indeed keep moving higher. However, as each day passed, things got a little more sluggish. In other words, the momentum has slowed quite a bit. In the case of the NASDAQ, we feel that the momentum has sowed enough now that we're likely to move backwards for a while. That dip, however, shouldn't be a major correction - just the garden variety retest of the key moving averages.
On our chart today, we've specifically added Bollinger bands to illustrate why the composite started to slow down. Much like we saw in May, the market started to cool off a couple of days after the upper band was reached. In fact, by the time June rolled around, things had cooled to the point of the NASDAQ just moving sideways - a consolidation period. That gave time for the lower band to catch up, and essentially provide a springboard for the rally we've seen over the last two weeks.
What's that got to do with now? A lot. History tends to repeat itself, and if May/June was any example, we should start to see something similar. In fact, we already have. Although the MACD lines are still technically bullish, we can see that the momentum here is tapering off, rather than expanding. To further weigh in on the index is the fact that we're so stochastically overbought. In May, the rally had the benefit of being oversold. Now the bulls are fighting some pretty strong profit-taking pressures.
As for where all of this might lead, we'll set support at 2100. That was the major resistance line for the year, and it's doubtful that the bulls would be willing to give up any more ground than that. Plus, that's where the 20 day simple moving average (gray) is, and that's about where the longer-term support line dashed will be by the time it becomes an issue. That 68 point dip should be healthy though.
On the other hand, despite being unmerited, there is the possibility of the NASDAQ breaking to new highs (above 2191.60). Should that happen, stocks could take off, disregarding all these little bearish hints. That will create a mini-bubble, but the time period between that breakout and the bursting of the bubble could be very bullish. We're anticipating the pullback, but we're prepared for the runup.
NASDAQ CHART

S&P 500 COMMENTARY
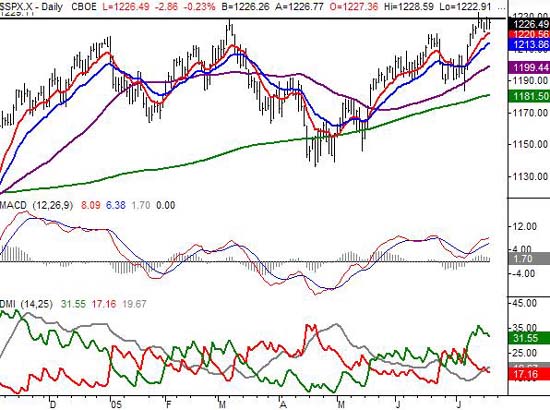
Where the NASDAQ has a little room to fall before support lines are met, the S&P 500 doesn't quite have the same vulnerability. The SPX's 10 day line is at 1220, while the low for the index today was 1222.9. Yesterday's chart showed about the same margin. The implication is just that any correction wouldn't be as harsh here. Should the 10- day line not hold, the 20 day line at 1214 could be the bounce point. After than, the 50 day line is at 1200, and that would probably be the worst case scenario. With the S&P 500 currently at 1227, it would only be about a 2.2 percent drop. It's enough to be noticed, and maybe even traded (if you're nimble), but it's not enough to undo the bigger bullish trend that's emerged over the last several weeks.
However, there's still resistance around the 1230 area. We saw a new 52-week high of 1233.16 on Thursday, but this chart has struggled to go any higher than 1230 since then. Why? We're betting it has a lot to do with this year's prior high of.......you guessed it, 1229.11 (from March). Historically, the move into new highs and lows is followed by more of the same. The last few months though, the threat of new highs has just brought about reversals. One of these days we'll break through, but it's never going to happen if there's hesitation at those pivotal moments. The last three days - that's hesitation. And that's why we expect to see some more consolidation here, if not a minor pullback.
Like the NASDAQ though, should the S&P 500 break past 1230, then we do run the risk of hesitation being replaced by giddiness. That type of bullishness is unhealthy, but that doesn't mean it can't be profitable - if you know how to play it. If we do indeed break out, we'll set targets later. You can also count on tight stops and caution if we get that bullish breakout, because once the euphoria wears off, stocks can fall fast. In the meantime, we'll wait and see what happens as the S&P gets wedged between support and resistance.
S&P 500 CHART

BOTTOM LINE
Between the point in time we wrote this commentary and now, stocks managed to work thier way up towards break-even levels. We'll just caution you against putting a lot of faith in the mid-day action. The closing price is the price at which investors are 'taking them home' at, so that's the real signal of how they feel. And even with the rally, stocks have yet to move past their recent highs, and the upward momentum is still slipping. Also, Keep in mind that, in the longer-term, we're seeing any dip as a buying opportunity. In the short run, we can't emphasize enough the application of the support and resistance lines we mentioned above - they're really the key to the next direction we take.
Price Headley is the founder and chief analyst of BigTrends.com.