|
Weekly Outlook in the Stock Market
NASDAQ Commentary
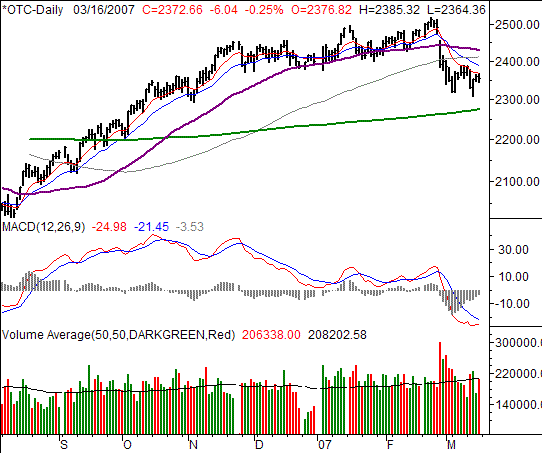
The NASDAQ Composite fared the best on Friday, only by losing the least. This index pulled back by 6.04 points (-0.25%) to end the day at 2372.66. There was at least a little hope after Thursday's strength that the bulls could make a go of it. But, the buying faded Friday, leading to a 14.89 points loss for the week (-0.62%). Though it's far from a certain doom scenario, we're obviously not counting on a major upside push this comgin week, though we haven't ruled it out either.
The discussion about all three index charts this week is pretty much the same, so we're not going to get into too much detail on the NASDAQ's daily chart. We'll just say this: The 10-day average was resistance last week, and the momentum is still to the downside in the wake of a break in a major support line. The bounce effort from a week earlier didn't stick - at least not very well. While we'd be willing to go back to a bullish stance if the 50-day line at 2445 could be breached again, we're not counting on it. Nor are we counting on the 200-day line at 2296 acting as support. If it happens, we'll respond then.
NASDAQ Chart - Daily

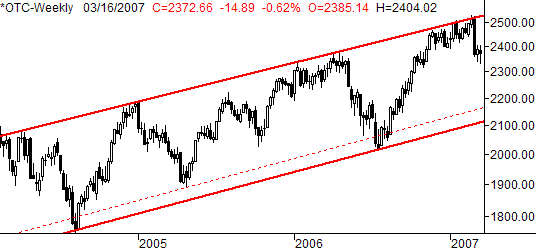
What we really want to key in on about the NASDAQ this week is what is clear on its weekly chart. Based on the long-term trading-range we've seen since 2004, the selloff may be far from over, even though a lot of pundits are saying we've already hit the bottom. Maybe we have, and maybe not. Just remember a lot of those same folks were saying the same thing several times over the last couple of years when we did indeed have more downside to go.
If there's no more selling in store for now, that will become clear soon enough.
NASDAQ Chart - Weekly

S&P 500 Commentary
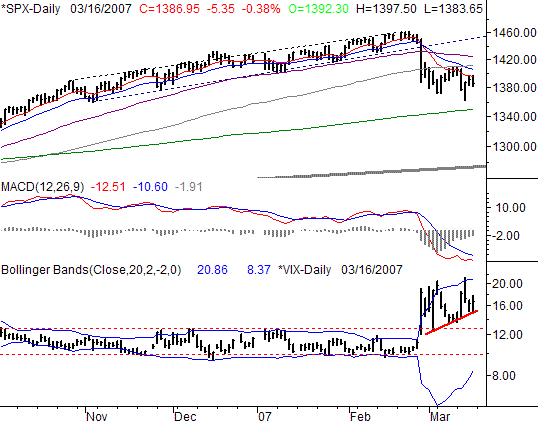
On Friday, the S&P 500 was off by 5.33 points, the second biggest loser for the day. Its 0.38% selloff left it at 1386.95. On a weekly basis, it was a loss of 1.13% that left the index 15.90 points under the prior Friday's closing level. The end of the week was a bit of a sour note, but then again, it was a triple-witching expiration -- a lot of oddball pressures were in play. But, we still don't have a major number of reasons to think we're actually at the bottom just yet. Is the VIX actually in agreement?
The SPX's momentum is still technically to the downside. After a decent gain last week, we closed in the red again. From this view, we have to stay bearish. Plus, we can now see the 10-day line (red) is acting as resistance.
More than that, the VIX is trending higher it seems. Note the thick, red support line on the VIX portion of the chart. It's currently at 15 and rising. If it breaks, then yes, maybe the lack of a floor for the VIX will come into play and be bullish for stocks (there certainly isn't any major support area for the VIX under that, until 10 or so). But, unless that happens, the VIX's trend confirms the bearish stance.
On the flipside, note how the MACD lines are starting to level off...and getting close to a bullish crossover. Though not shown on our chart of the S&P 500, the well-oversold stochastic chart is also close to a buy signal of its own. All potentially bullish forces, though none are yet in place.
At this point, even if we get a stochastic or MACD buy signal, we'd say the safe move would be to wait for a close or two above 1412 at least, or above 1425 to be even safer. The former is where the 100-day line is, while the latter is where you'll find the 50 day average. There's no ceiling above that, so the index could find plenty of room to run (recover) if it can just get a good start. Anything less than that would be an iffy buying point.
The only line left under the current daily bars is the 200-day line (green) at 1350. It could be a factor if things continue to deteriorate, though we're not necessarily counting on it. The only support level below current prices is the very long-term support line at 1275 (thick, grey). It would be a big drop, but as spring rolls in, it's a distinct possibility.
S&P 500 Chart - Daily

Dow Jones Industrial Average Commentary
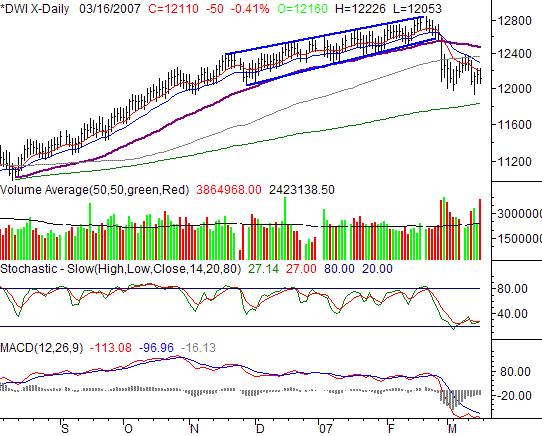
The biggest (and perhaps most surprising) dip on Friday came from the Dow Jones Industrial Average. It was off by 0.41% (-49.27 points), closing out at 12,110.41. That was 165.91 points under the previous week's close, meaning the typical blue chip fell 1.35% last week. That's not a particularly encouraging sign for the Dow, especially after seeing it struggle with the 10-day average late in the week.
The zoomed-out chart here really pouts things into perspective. Like the S&P 500, we're poised for a bullish MACD or stochastic buy signal soon, but neither has actually materialized yet. And, maybe they won't for a while. Yet, we're watchful for both.
In the meantime, the Dow is still struggling with resistance at it short-term averages. The upper-most one of them is the 50-day line (purple) at 12,486. Only a cross above that mark would really mean much to us in a bullish way. We're not necessarily looking for support at the 200 day line either, at 11,819.
Again, all of that was said about the S&P 500.
The only thing we'll add that's new is this is for the first time in months the 50-day average is pointed lower, and the short-term averages are under the intermediate-term ones. There has to be a reason for that.
Dow Jones Industrial Average Chart - Daily

Price Headley is the founder and chief analyst of BigTrends.com.
|