With the VIX hitting yet another new low yesterday, we're getting a lot of questions about how long it can keep falling. And more importantly, how are traders supposed to respond to it. Today'd we'd like to address two of those questions, because we think the answer will help all of us get a handle on what's really going on with the VIX.
Q. My question is, how do I best go long the strong near term return of the VIX to say the 12 level. Is there an option over the futures contract? From my readings a VIX pop seems more likely than clinging to near record lows here at 10.5.How do I best follow this hunch in a best managed and prudent manner,allowing for both time and direction requirements?
A: There are no VIX call or put options (although we seem to recall the idea being examined at one point).
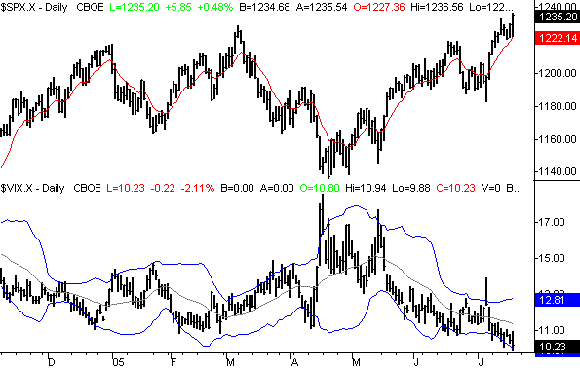
Yes, from here, a VIX move higher seems much more likely than this continued trek into new lows. Then again, we were saying something similar to that several days ago, and the VIX just kept sinking. We'll just say this - it's like a rubber band. The further a rubber band is stretched, the more likely it is to snap, and the more violent that snap will be. In the same way, the lower the VIX goes, the bigger the bounce is going to be. The question is - and has been for a while - when will it happen? We anticipated it happening in mid-June, and to a small degree, it did. However, the bombings in London appear to have exhausted the VIX's uptrend that very day, and forced the market into a short-term bottom. If you look at the chart, both the VIX and the S&P 500 gave us long-tailed reversal patterns that day. Had it not been for that, the VIX would probably still be moving higher, and the market could still be pulling back. Instead, those reversals followed through to get us where we are now. And where is that? The market is approaching new multi-year highs (the SPX already hit them), and the VIX is well into new lows.
So to answer the question........
There is no definite answer. The VIX moved from 11.30 to 17.74 over a span of three day in April, while the S&P lost 44 points. So based on that, the move could realistically last three days. Or it could last for a few weeks, and stocks could make a prolonged downtrend like it did in March. There just isn't an easy answer. Rather than try and anticipate the size and duration of the VIX's bounce, we'd just say wait for it to reveal its direction, and then act.
If you're looking for a very short-term bearish trade, you could enter it when the VIX makes a couple of higher closes as the S&P 500 makes a couple of lower closes, provided both the VIX and the SPX are clearly shifting their directions. We'll just warn you that it wasn't clear the VIX was shifting directions back in April until the move was halfway over. In other words, if it's only another three day selloff, it may take a day or two of that selling until it's an obvious trade.....you'd have missed the boat. In that sense, the last thing you'd want to see is a repeat of what we saw in April. The easier bearish trade to take would be a setup like we saw in March, because it would last longer and actually be a bigger move.
If you're not interested in a short-term bearish trade, but are rather waiting for stocks to pull back before jumping in, well, you're in good company. We've pretty much been telling folks to be patient here. The rally looks strong (and it is), but with the VIX this low, it's only a matter of time until we suffer a big correction. In this sense, you'd want to see a repeat of April. It was something of a capitulation then, and it set up a very nice (and prolonged) upside move for stocks. We're bullish in the bigger picture, but we're waiting for the VIX to move well above these lows before we get too bullish.
How high is "high enough"? You mentioned 12, but frankly, we'd like to see it closer to 18, like we did in April and May. But the truth is, there's no specific level that you could consider the norm. That's why we plot Bollinger Bands....to show us what 'high enough' is at any given time. Of course, that "high enough" level will change every day. It's all relative.
S&P 500 with VIX - Daily

I'm not sure if that answered your question or not, but that's our view on the VIX right now. You mentioned following your hunch. If that has historically worked for you, then go for it. However, we've found that mechanized systems serve us far better than our hunches. As an example, a lot of people had a hunch that the VIX would finally start to move higher yesterday. Didn't happen. It was quite the opposite. That's why we're waiting for some very specific chart events to occur before we change our outlook.
Q. I am wondering if there is any relationship between the VIX being very low now and the Put/Call Ratio being over 1?
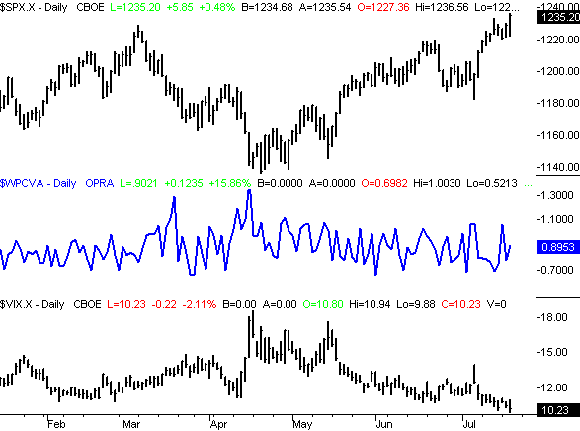
A. Normally, the VIX and the put/call ratios move in the same direction. In other words, a high put/call reading usually occurs with a high VIX reading, and a low put/call ratio usually coincides with a low VIX. However, this hasn't been the case since May, when the two diverged. In fact, this is part of the current frustration regarding these sentiment indicators. One can typically verifiy the other, but right now, they can't. All of the put/call ratios (we used the total CBOE put/call ratio on our chart, which includes index options) should be at rock bottom right now.....but they aren''t even close. I suspect that in this chart, there's an explanation of how/why the VIX can just keep on sinking lower - it may not be indicating 'fear' or 'confidence' the way is usually does. It may just be indicating a shift in option premiums. Were there actually a big problem with too much confidence, that would show up with a very low put/call ratio.
S&P 500, CBOE Total Put/Call Ratio (Index + Equity), CBOE VIX

Note that the "equity" only put/call ratio is a little lower than the ratio we see here. It doesn't change the observation though - the put/call readings don't correlate with the VIX, which is very unusual.
Price Headley is the founder and chief analyst of BigTrends.com.