|
Weekly Outlook in the Stock Market
NASDAQ Commentary
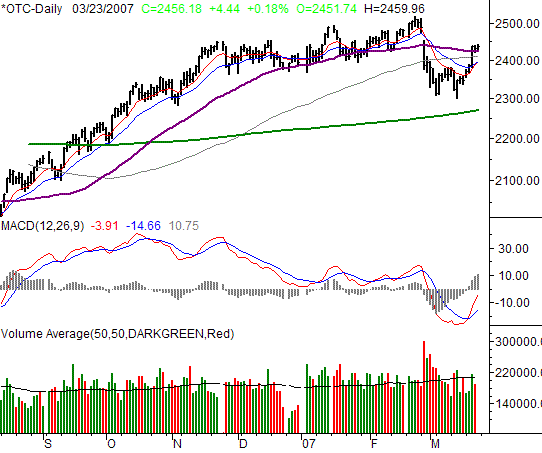
The NASDAQ Composite's 4.44 point gain on Friday was the result of a modest 0.18% rally. However, the rest of the week was amazingly productive for the index. It gained 83.52 points, or ended 3.52% above the previous week's close. The NASDAQ ended the day at 2456.18. The big move tripped a lot of technical buy signals, but can this bizarre strength actually be sustained?
The commentary for all three indices is pretty similar this week, so we'll be brief with the NASDAQ and focus a little more on the other two charts. However, there are a couple of things we do need to review specific to the composite.
Fist and foremost, the cross above the 50-day line (purple) pushed the index past the last potential tripwire. It wasn't a particularly strong cross of the line though, so we'd prefer to see at least a little more progress before saying the uptrend has been fully renewed.
As far as support goes, the 10- and 20-day lines around 2418 are the levels to watch for any potential downside move.
NASDAQ Chart - Daily

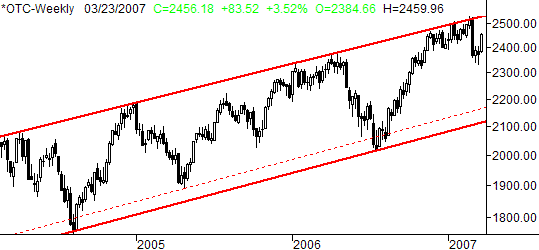
In the meantime, well just re-insert this weekly chart of the composite as a reminder of the kind of potential pullback we still need to be aware of. We dodged a bullet last week, and may actually end up dodging that bullet altogether. However, just absorb what this chart could mean if the selling got another good start.
NASDAQ Chart - Weekly

S&P 500 Commentary
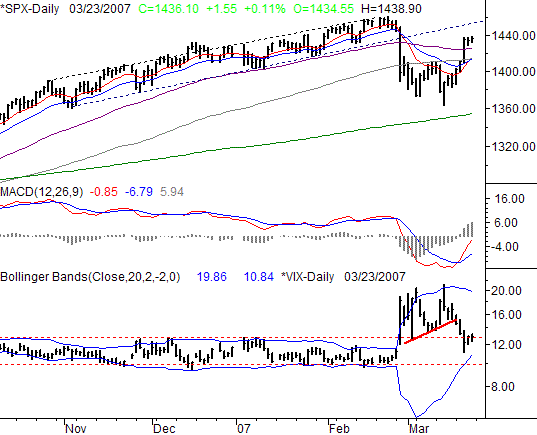
The S&P 500's close at 1436.10 was the result of only a 1.55 point gain on Friday - a move of only 0.11%. For the week though, we still saw a 49.15 point rally, leaving the index 3.54% higher than where we saw it a week earlier. The technical look pretty bullish as a result.
Take a look at the short-term averages -- all of them. It was only a few weeks ago we were lamenting several bearish crossunders. As of Friday, we're on the verge of the 10-day line crossing the 20-day, and both the 10- and 20-day lines crossing the 100 -day average. Along the way, the SPX hurdled all those averages, as well as the 50-day line (purple) - the last remaining potential barrier. While you'll detect a bearish slant elsewhere in this update, those crossovers are all technically bullish.
The possible trump card, though, is the CBOE Volatility Index (VIX). It was falling sharply early in the week, while the market was rallying. However, the move lower has reversed or at least stopped. We saw the VIX creep higher over the last two days, even though the market drifted higher as well.
From our perspective, now that the VIX has more upside room to travel than it has downside room (look where the Bollinger Band lines are), the threat to the bulls is bigger than the threat to the bears -- at least in terms of the VIX. However, either way, it's still a little soon to say what's going on there. The VIX could hit the lower band line and just trail it lower - bullish for stocks. We'd really like to see the VIX touch that lower band first so we can see what happens, though we may not get that luxury.
In the meantime, the index stalled late last week, and we have to wonder why. To be safe, the key to any further upside is getting past last week's high of 1438.90. However, only a move under 1410 - where the 10-, 20-, and 100-day lines are all tangled - would get us thinking bearishly.
S&P 500 Chart - Daily

Dow Jones Industrial Average Commentary
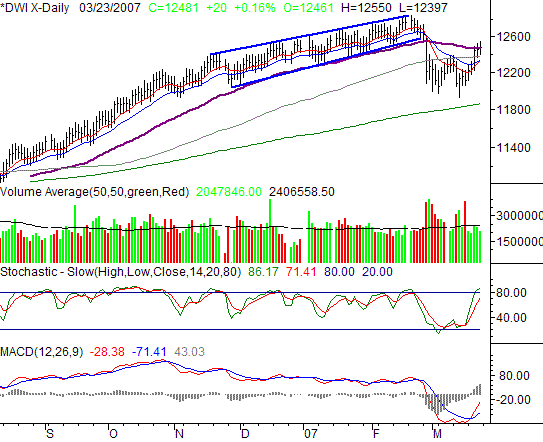
On Friday, the Dow Jones Industrial Average added 20 more points (+016%) to close out at 12,481. That meant a 371 point gain for the blue chip index, leaving the Dow 3.06% above the prior Friday's close; it was the best week the Dow has seen in four years. Nice move, and certainly suggests things are 'all safe' again for the bulls. But, are they really?
You know what's really conspicuously missing from this chart, and the recent bounce specifically? Volume. The buying effort behind the recent bounce hasn't even been average. That's not exactly the best sign that the move higher will have much longevity.
Plus, we're also a little hesitant to jump in blindly simply because a bounce was likely. A week and a half ago, following one of the worst weeks we've seen in years, the Dow was sharply oversold according to the stochastic chart. Now take a look - we're getting into overbought territory. Recent history has shown that to not be a problem, but it's still a concern at this point. After all, a lot of the technical damage taken a month ago is still lingering.
The point is, we're not euphorically optimistic here.
To really get us over the proverbial hump, we'd like to get decisively past the 50-day line (purple). It's currently at 12,473. A couple of closes (consecutively higher closes, mind you) would do the trick. As far as support goes, only a close or two under the 10- and 20-day averages at 12,331 would out us back into the bearish camp.
Dow Jones Industrial Average Chart - Daily

Price Headley is the founder and chief analyst of BigTrends.com.
|