| The Scoop on Fibonacci Retracement Patterns |
| By Andy Swan |
Published
03/26/2007
|
Currency , Futures , Options , Stocks
|
Unrated
|
|
|
|
The Scoop on Fibonacci Retracement Patterns
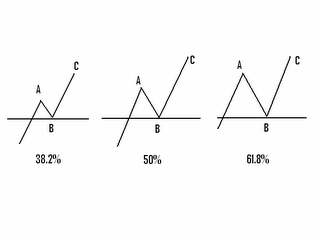
It is very common for a stock to pull back or retrace a percentage of the previous move just before a trend reversal. The retracement often occur at one of three levels, which are reflective of Fibonacci numbers, 38.2%, 50%, and 61.8%. The numbers are usually rounded off to 38%, 50% and 62%. A stronger trend will see a retracement around a minimum of 38%, and in a weaker trend, a maximum percentage retracement is usually around 62%. A complete or 100% retracement in a previous bear or bull market should also mark an important support and resistance area. Below is a graphic example of the retracement pattern as would occur in an uptrend. The images would be reversed in a downtrend.

When looking at stock activity in the above picture, you can see the stock make a move to the upside (point A), then make a retracement of part of the move (point B) before it moves on in the trend (point C). These retracements are what Swing traders will be looking for when initiating a long or short position.
When the stock begins to pull back or retrace, the retracement levels can be plotted on a chart so our trader can begin looking for signs of a reversal. A trader should never jump right into a trade without using other technical analysis tools to confirm a reversal. He or she should start at the 38.2% level, if there are no signs at 38.2%, go down to the 50% level and look for a trend reversal there. Once confirmation is made then a position can be entered.
Andy Swan is co-founder and head trader for DaytradeTeam.com. To get all of Andy's day trading, swing trading, and options trading alerts in real time, subscribe to a one-week, all-inclusive trial membership to DaytradeTeam by clicking here.
|