| Spotting the Undertow in the Stock Market |
| By Price Headley |
Published
03/29/2007
|
Stocks
|
Unrated
|
|
|
|
Spotting the Undertow in the Stock Market
Today we've got an indicator that's not quite that far out there, but still not in the mainstream of technical analysis either. Yet, it's one of my favorites, since it effectively combines two important trend indicators into one, easy-read-tool. I've talked about the Chaikin line before, but for anybody who doesn't remember, here's the skinny.
To spot the hidden momentum in the market, the clue lies in volume. More specifically, the clue lies in whether or not the volume is selling volume or buying volume. If the market loses ground on heavy volume, that's an indication that most people are thinking like sellers. Conversely, an up-day on big volume means investors are more apt to be net buyers. If you get enough of one or the other over a few days, then you have yourself a trend.
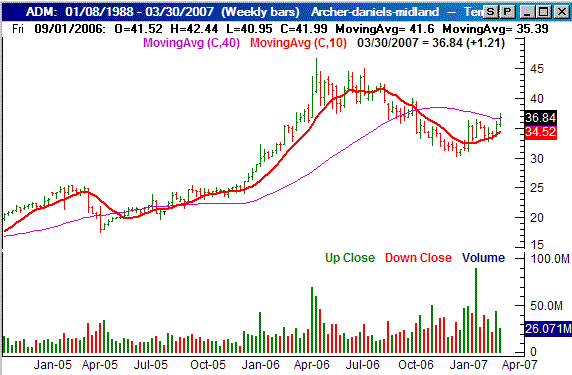
In the middle of our chart below, you can see the weekly volume trend for Archer-Daniels (ADM) indicated by the height of each day's volume bar. Red bars are selling volume, and the green bars are buying volume.
Generally speaking, you see more red than green through the end of last year, while the stock was sinking. However, you can also start to see more green than red volume bars, when the stock starts to move higher again. Granted, that's the way it was to inevitably work Gains are what paint the bar green to begin with. However, keep reading after you take a look at the ADM chart.
Archer-Daniels Midland (ADM) with volume data, weekly

The problem is, the volume piece of the chart - in bar form - can seem like a jumbled mess to the naked eye.
What is not quite as evident - though still recognized by the seasoned trading veterans - is that volume clues often come before or right at the very beginning and end of trends. More importantly, big movement without big volume behind it (in either direction) can also make for a short-lived trend (read fake out).
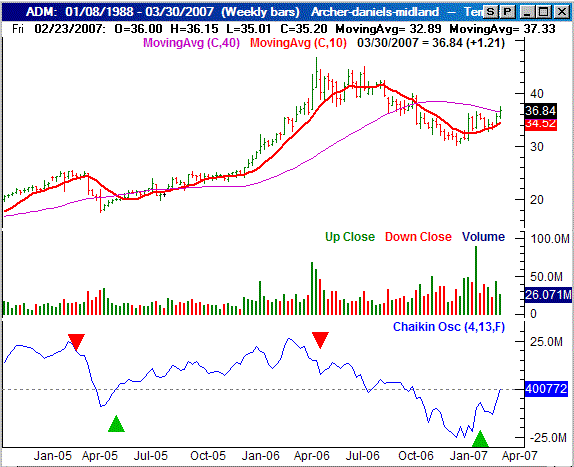
So is there an easier way to spot a volume trend at least when a new trend starts, or preferably before hand? You bet. It's the Chaikin line you see at the bottom of the next chart.
Essentially, the Chaikin is a volume-weighted momentum line. [Technically, it's a normalized accumulation-distribution line, but don't get bogged down by the formula - the principle is the key here.] The smoothed data lets you easily spot the underlying volume trend. A rising Chaikin line can alert you to net buying in the market, even if stocks head lower a couple of days. Likewise, a falling Chaikin line shows you that there are more sellers than buyers, even if stocks move higher.
On the same Archer-Daniels char, we've now included a Chaikin line. What was once erratic, and almost useless, is now a very powerful trend indicator, and a tool that includes that critical longevity key - volume. Note how the direction of the Chaikin line mirrored the new trend before or right as the turn was made. Even when it would have been hard to go against the grain, the Chaikin line would have steered you right. Take a look. (The confirmed Chaikin turns are marked with arrows.)
Archer-Daniels Midland (ADM) with volume data and Chaikin line, weekly

Isn't it amazing how a simple tool can keep you ahead of the curve? How does it work? I think most of the time, this is the so-called smart money or 'in the know' folks who can quietly transact a lot of shares before news or events occur. Other times, it's the heavy volume buying/selling that probably jumps-starts a new trend. Either way, following volume can pay off big, as it usually leads the price trend.
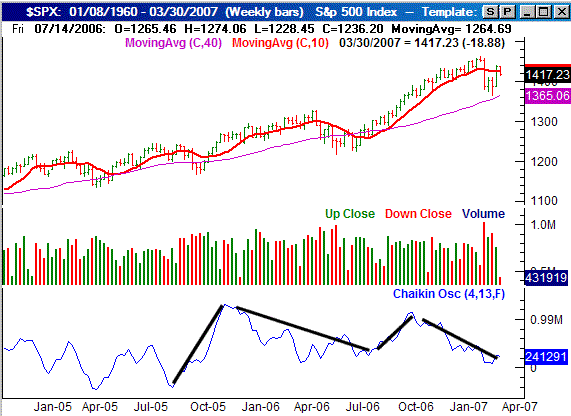
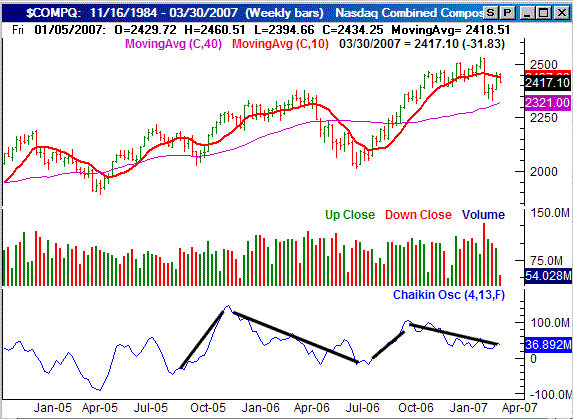
Some current index charts and their own Chaikin lines. Take them for what they're worth. The blue lines are still the Chaikin lines. The thicker black lines were just added to illustrate the overall trend direction - though hindsight is 20/20.
S&P 500 with Chaikin line, weekly

NASDAQ Composite with Chaikin line, weekly

One of the thing we didn't do this time, but will for next time, as apply a moving average to the Chaikin line to smooth it even further. Incredibly, even the index volume has been pretty erratic lately, forcing us to revert to unusually measures to get a read on the undercurrent.
Price Headley is the founder and chief analyst of BigTrends.com.
|