|
Weekly Outlook in the Stock Market
NASDAQ Commentary
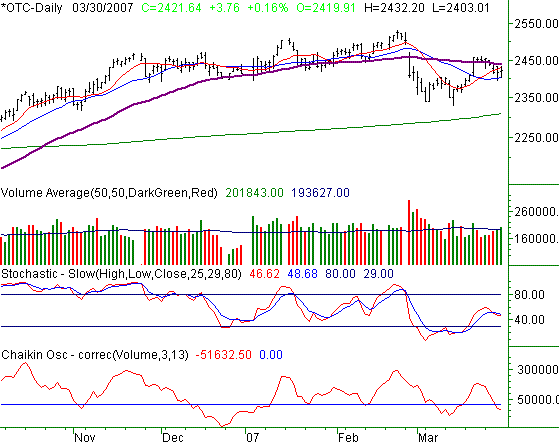
The NASDAQ Composite was the only major index to pull out a gain on Friday, albeit a small one. The tech-heavy index closed 3.76 points higher, up 0.16%, to end the session at 2421.64. However, we still saw a loss for the week, as the composite closed 27.29 points under the prior week's close, or -1.11%. Is this the beginning of the next wave of selling?
In really simple terms, the NASDAQ seems trapped between the 10- and 20-day lines. As you'll read again below, when we look at the S&P 500 chart in detail, that's something of mixed message, making it hard to say anything one way or another. So, we won't.
However, we will point out one thing - the NASDAQ's close under the 50-day line (purple) is not insignificant. It has been support in recent months, and an excellent indication of the beginning and end of intermediate-term trends. To see the SPX struggle to even test the waters above it, only to fall back under it three days after that, speaks volumes to us.
In the short run, a close under the 20-day line (blue) at 2400 cold be a short-term sell signal, while a close under the bottom made on March 14, at 2331, could lead to longer-term bearishness.
On the flipside, a close or two back above the 50-day line at 2439 could inspire more buyers back to the table. In the meantime, patience.
NASDAQ Chart

S&P 500 Commentary
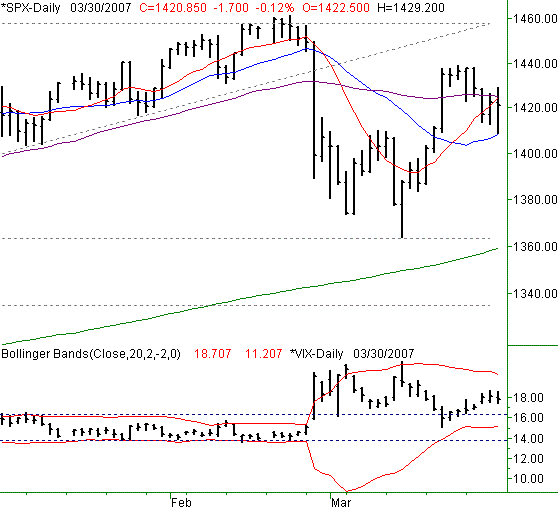
The S&P 500 couldn't hold onto Friday's gains, pulling back by 1.7 points (-0.12%) to end the day 1420.85. That was 15.25 points under the previous Friday's close, for a weekly loss of 1.06%. The week before last, it looked like a full-blown recovery was underway. Last week was a reminder that the market isn't exactly all clear.
The bearish argument is simple. The slide back under the 50-day average (purple) and the 10-day line (red) is a short-term and intermediate-term sell signal.
The bullish argument is simply that the 20-day line (blue) acted as support on Friday, managing to keep the SPX well off its lows of the day by the time the closing bell rang.
Equally confounding is the VIX. For most of last week it was on the rise, as it was the latter part of two weeks ago. That should have been bearish for stocks, but wasn't. Yet, we also saw the VIX trade lower (lower range) and close lower on Friday -- a hint that the momentum has shifted to the downside. That should be bull-sh for stocks, yet the market eased off a bit on Friday. Go figure. So, as of right now, bit the market's momentum as well as the VIX's direction is a coin toss. How do we play it? As usual, keep an eye on the moving averages -- the 20- and 50-day lines in particular. Crosses of them are usually the momentum signals we like to see.
As for the VIX, it could go either way, being right in the middle of its band lines. However, based on the last look at the VIX, we see downward momentum setting in, which has bullish implications. But still, we'd wait for a little more certainty.
S&P 500 Chart

Dow Jones Industrial Average Commentary
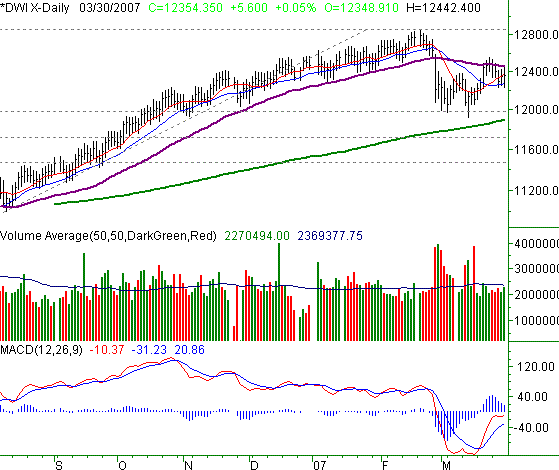
The Dow Jones Industrial Average ended Friday higher by a mere 5.6 points, or 0.05%, to close out at 12354.35. For the week though, that still meant a loss of 126.66 points, or -1.01%, thanks to Tuesday's and Wednesday's big sell-offs. As a result, the blue-chip index finds itself parked (again) back in that no-man's land -- not bullish, but not bearish. Like all the indices, the Dow is trapped between the 50- and 20-day lines (purples and blue, respectively) -- another stalemate. The only thing(s) we can add here are that there still hasn't been any real volume behind the recovery effort, leading us to think it's not a high quality recovery. That is, it may not be able to really produce one longevity or gains.
Those Fibonacci lines we talked about a couple of weeks ago? They're still on our radar. The first one that might come into play is the 38.2% retracement at 11,983. Theoretically it's supposed to be support, but if it's not, the next likely landing spot would be the 61.8% retracement at 11,470. (There's a very small chance the 50% retracement line at 11,719 could be support, but that's not exactly a Fibonacci-based line.) A move all the way back to 11,470 would mean a 10.7% correction from the recent high, which is supposed to be the bare minimum pullback to qualify as a normal correction. The point is, we're still keeping an eye on the Fibonacci lines, as they may hold a lot of clues about where things could start and stop.
Dow Jones Industrial Average Chart

Price Headley is the founder and chief analyst of BigTrends.com.
|