| Is It Playtime in the Sector Analysis? |
| By Price Headley |
Published
04/2/2007
|
Stocks
|
Unrated
|
|
|
|
Is It Playtime in the Sector Analysis?
While we hate to keep going back to the same sectors over and over again, we don't mind it too much - as long as there a consistent trend. And, it appears there is. Of course, we have a renewed trend to add, plus a red flag.
Toys
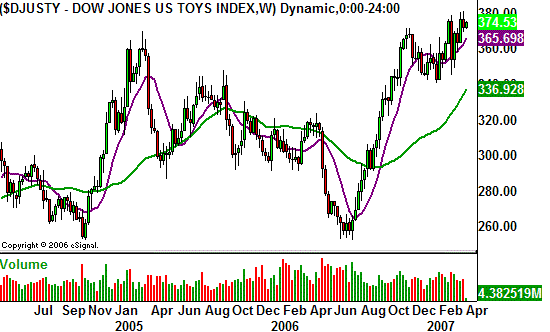
We've been watching the Dow Jones Toy Index (DJUSTY) for several months now, primarily because it tends to trend quite well - once it gets going. Though we've seen a lot of chop over the last few months here, over the last couple of weeks it seems like the bulls are starting to make an impact. This is most evident on a weekly chart, which is what you'll see below.
After hitting a new multi-year high in February, we hit another one in March. And, after a small pullback, we look poised to do it yet again. That may be enough rocking to finally get the index out of its consolidation mode and moving higher again. And if it does get moving again, then look out above - the last trend in the middle of last year was good for a 28% move. Though we've seen a lot of false here, this chart is more apt to put up monster-sized gains once it does get some traction.
Dow Jones Toy Index (DJUSTY)

Biotech
Risky? Yes, but like the toy index, a good rally here could mean gigantic gains.
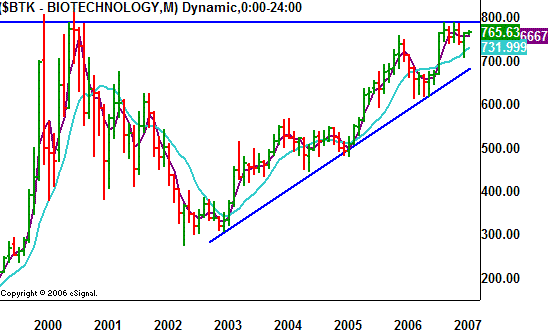
We're using a monthly chart not so much because we're thinking an ultra-long trend here, but only to illustrate the potential rally-trigger. The AMEX Biotech Index (BTK) is pressing at all-time highs, near 800. At the same time, we recently saw a dip all the way back to the 200-day average (teal), and a strong push back above the 50-day line (purple). This may have effectively reloaded the bigger picture uptrend that nobody else seems to have noticed. The index is up 149% from early 2003 lows, thanks to some guidance from a key support line.
So, we have three reasons to like biotech's chances right now. The first is a break to new highs. The second is another wave of buying after a pretty strong dip -- a pattern that's been in place for over three tears now. What's the third reason? Biotech can be a safe haven from the rest of the market. If thing turn weak soon, biotech won't necessarily follow that same path.
AMEX Biotech Index (BTK)

Financials
We've done everything we can to justify staying optimistic on the financial stocks. However, we're not going to fight the chart.
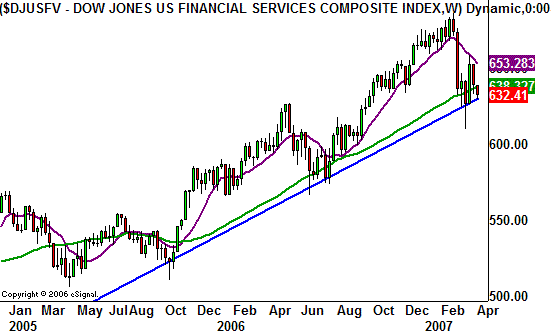
For the second time in a moth, the Dow Jones Financial Services Index (DJUSFV) is back under the 200-day line. It's not exactly a huge deal, as we've seen it happen before and not mean much. In fact, the last time we saw it, a huge recovery came just a few days later. However, as elevated as these names have been, the floor is considerably lower than it was.
The final straw will be a close under that key support line (blue), currently at 629, but rising. If you really wanted to be a stickler, you could wait for a weekly (Friday) close under the mid-March low close of 626.
Either way, just keep in mind the financials are really at a critical make-or-break point, and leaning on the 'break' side of the table.
Dow Jones Financial Services Index (DJUSFV)

Price Headley is the founder and chief analyst of BigTrends.com.
|