NASDAQ COMMENTARY
The weekly action continued to be encouraging in the wake of the prior Thursday's London terrorist bombings, as the market generally shrugged off bad news - from the expected Chinese revaluation of the yuan to 3 amateurish bombs that went off in London, to poor earnings from Google and Microsoft. For all this the Nasdaq finished up on the week by just over 1% while the other major indices were relatively flat, an encouraging sign to not go down in any meaningful way on the bad news.
This week we actually take a step back to see the big picture on the major indices, in the form of a look at the monthly chart trends. All in all, they look encouraging, with one warning sign that bears watching after a further rally
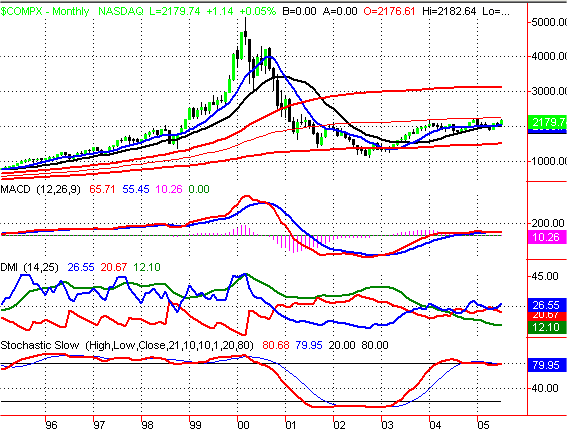
When you look at the monthly chart of the Nasdaq Composite below, you can see my 20-month Acceleration Bands (in red) plotted around the simple 80-month moving average (this would be roughly equivalent to a 1600-day moving average, so we're talking about truly long-term trends compared to the usual 200-day moving average). You can see that the Nasdaq Composite is back within the Acceleration bands so the market does not have the accelerating potential of the market in the 1990's. But there is potential up to the 3000 level over the next few years. The problem is that the 20-month average has been holding the Nasdaq in check at the start of both 2004 and 2005, as well as back in January 2002. So we need to see the Nasdaq close at the end of a given month over the 2250 level to open the door to the bigger upside.
You'll also notice that the Nasdaq is holding above both the 10-month moving average (in blue) and the 20-month moving average (in black). More importantly, the 10-month average has recently "kissed" back into the 20-month moving average but not closed below it. These crossovers tend to be great signals for the direction of the longer-term trend, as we saw on the downside at the beginning of 2001 heading into 2 more nasty bear market years, while the upturn in September 2003 suggesting a budding uptrend. So for now all systems are go for continued bullishness, with the real spark to light this candle occurring once we see a monthly close over the 80-month average around 2250.
NASDAQ COMPOSITE CHART - MONTHLY

S&P 500 COMMENTARY
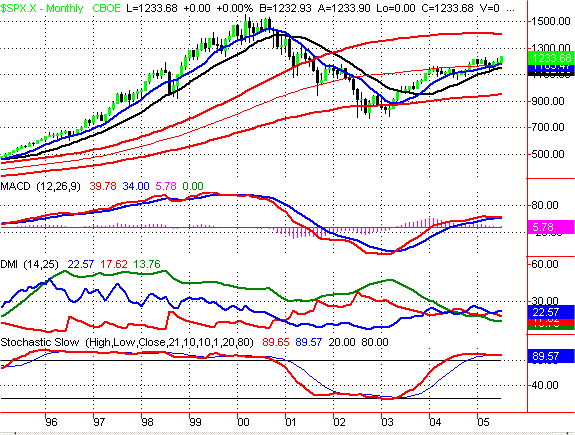
The S&P 500 chart on a monthly basis actually looks even better that the Nasdaq chart, as the SPX is above its 80-month moving average. This sets in place the bigger upside target at 1400 over the next couple of years, with a likely stop at 1300 along the way as a prior key resistance level. But we would expect 1300 to be tested before this year is out. You can also see how nicely the S&P 500 has held on retests of the 10-month and 20-month averages, as we just saw back in April. The breakout to the highest levels in the last 4 years appears to have more room to run higher. We also like how the 21-month Stochastics (in red) is staying above the 80 level. Most traders have been taught to sell a market that has such an "overbought" reading, but my systems tests showed that the best uptrends are the ones where the Stochastics stays persistently above 80. If you're a skeptic here, look at the persistently overbought Stochastics over 80 from mid 1995 to late 2000, one of the best uptrends in the last several decades. So for now we are best served to ride this momentum until the overbought condition truly fades, which we don't expect to see for many months.
S&P 500 CHART - MONTHLY

DOW JONES INDUSTRIAL AVERAGE COMMENTARY
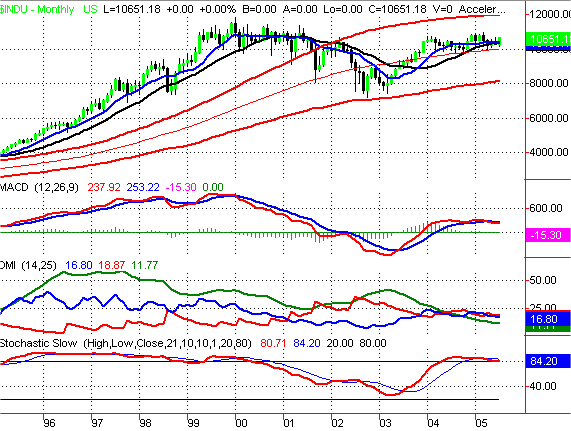
The Dow Industrials are just coming off another successful test of their 10-month and 20-month moving averages as support this month, and they appear to have some room to play catch up via a retest to the old highs first at 11,000 then 11,500 and ultimately to the upper Acceleration Band around 12,000. Momentum has been a little weaker in the Dow compared to the other big indices, as the MACD rolling down a couple of months ago. But this would only concern us if the red MACD line went below zero, which is many months off as a possibility. We also like how the Dow is also staying overbought above the 80 level on the 21-month Stochastics line in red.
DOW JONES INDUSTRIAL AVERAGE CHART - MONTHLY

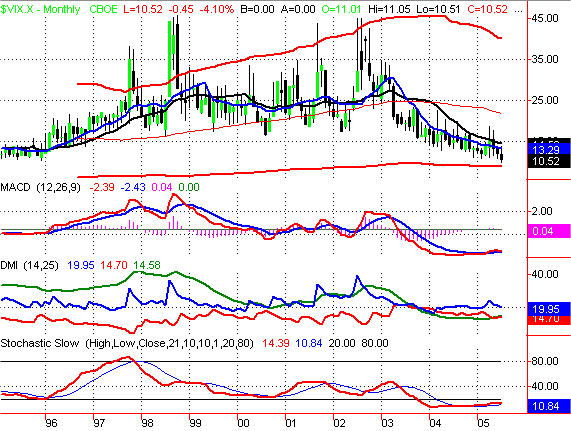
If there is a fly in the ointment, it comes in the form of the continuing decline in the CBOE Volatility Index (VIX) to the lowest levels in the last 12 years. You can see on the chart below how spikes to the upper 80-month Acceleration Band (in red) occurred at times of extreme fear, which were great chances to buy in both the bull and bear markets. But now we are on the other end of the spectrum, as complacency is near an extreme. This lack of worry usually is when you should start to get concerned, at least for a correction within the longer-term uptrend. Looking at the 20-month average of the VIX around 15, that should hold on a monthly closing basis to keep the VIX from going higher (which would be bearish for stocks if the VIX closed a month over 15). But the lower Acceleration band is currently at 9.13, versus, Friday's close at 10.52, so we're thinking the stock indices can run higher to drop the VIX down near this band, and then traders may want to take some bullish profits and buy into the next spike up in the VIX near 14-15 on a longer-term basis.
CBOE VOLATILITY INDEX CHART - MONTHLY

BOTTOM LINE
We have to grade the S&P 500 more strongly than the Dow and Nasdaq on the monthly charts, though the Nasdaq has the most upside potential if we can see another upside breakout in the coming months. But we will also keep a close eye on the VIX, as if it stretches down to the 9 area, that will be an extremely low reading that could cause a hiccup along the way for the markets.
Price Headley is the founder and chief analyst of BigTrends.com.