|
A Mid-Week Look at the Market
Stocks have remained a little enigmatic so far this week, just a few days after showing us a stroke of strength by moving back above all the key moving average lines. We were lulled into thinking it was going to start a renewed wave of bullishness. Though we haven't necessarily seen the opposite of that just yet, we're not exactly seeing great follow-through either. To make a long story short, we still see a lot of potential problems for the bulls, not the least of which is the calendar.
Today's discussion will be short and sweet. Why? Two reasons. One, the major chart issues and milestones are basically the same for all three indices, and two, despite eight straight days of gains for the Dow (a streak that ended on Wednesday), the market has been extremely lethargic over the last five sessions -- until today's sellers were woken up.
NASDAQ Commentary
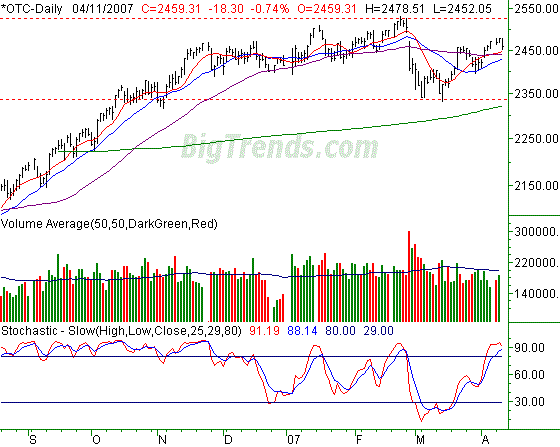
After an 18.30 point loss on Wednesday (-0.74%), the NASDAQ is now parked at 2459.31. That's 0.49% below last week's close, 12.03 points under last Friday's closing level.
We mentioned it a few days ago, but it bears repeating now. We've yet to see any real volume behind the recent strength. Perhaps that's how the market slipped on Wednesday, seemingly out of nowhere.
Or, maybe it was the fact that we're stochastically overbought. Though it wasn't a problem last year, being overbought in 2007 has been problematic. On the flipside though, being oversold had been an excellent buying point. The sideways range (marked by red dashed lines) is still worth noting. The high end is at 2526, while the low end is at 2340. Using that range along with stochastic lines may help you spot some nice entries or exits.
As you'll read of the other indices, the NASDAQ's position above all those key moving average lines still means the uptrend is alive, even if Wednesday's pullback makes the rally suspect. If the 20 day average at 2432 breaks, then we may have a bigger problem. Until then, we're on the sidelines.
NASDAQ Chart

S&P 500 Commentary
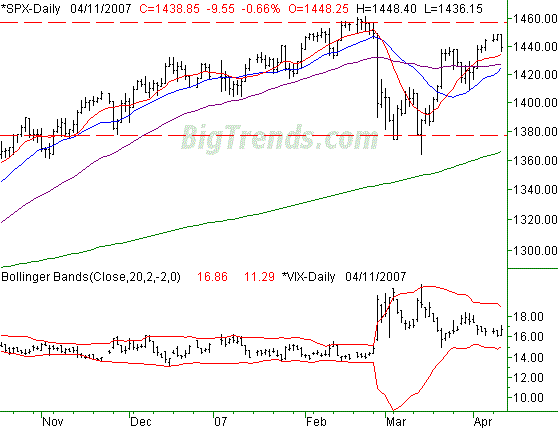
The S&P 500's close of 1438.85 on Wednesday was 9.55 points (-0.66%) lower than Tuesday's ending level. For the week, the large cap index is now down by 4.9 points, or 0.34%.
Despite what may seem like pessimism from our end, the fact that the SPX is still on top of all of its key moving average lines. As long as that remains the case, we can't get too bearish. The line in the sand remains the lowest of the three short-term ones - the 20 day line at 1424.
From a bigger-picture perspective - and even if the 20-day line fails to act as support - we're still seeing a range-bound market. The zone just happens to be between 1377 and 1457 (which we know is not the recent absolute highs and lows). We suspect those lines will play a role again eventually.
S&P 500 Chart

Dow Jones Industrials Commentary
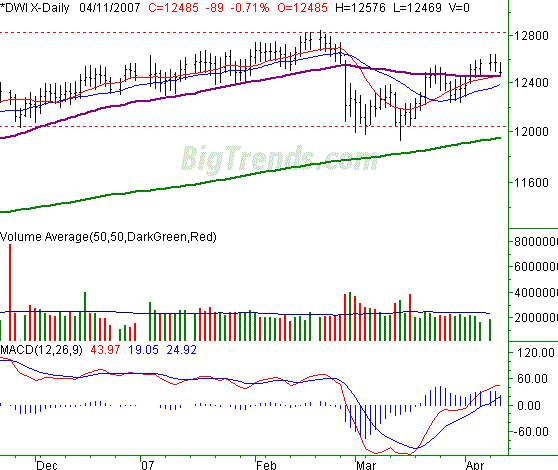
Of all three major indices, the Dow is the one applying the most pressure to its limits. How so? Take a close look at the chart, and you'll see Wednesday's low was right at the combined 10-day line (red) and 50-day line (purple). Both were support so far, but the week isn't over yet. Plus, the weak open, tepid rise, and then the weak close hardly screams buying frenzy.
Like the other indices, the 20-day line at 12,389 is the critical support line to watch. The longer-term support and resistance levels are at 12,828, and 12,060.
In any case, the Dow lost 89 points on Wednesday, or -0.71%, to close out at 12,485. Fir the week, it's in the hole by 75 points, or -0.60%.
Dow Jones Industrials Chart

Bottom Line
We've mentioned a couple of times that the "Sell in May and go away" notion was likely to be applicable this year. Are investors getting an early jump on the advice? From our point of view, it's still a bit soon to ay. However, we don't know that interest has been just plain flat of late.
The other trump card is the looming tax deadline (do you have yours done?). Theoretically, the tax bills that come due on the 17th of this month are supposed to create selling mood, if not a selling need. Though we have no empirical evidence that the theory is true, we have none to refute it either. Regardless, logic says there may be something to it.
Yet, what happens on April 19 when it's all said and done? That's the real question, as this week is likely to end up being a wash - or something close to it - at best. We don't really have an answer. We do have a response though.
Even if the market falls asleep as April turns into May, we firmly contend it's a mistake to just sit on your hands. There are always opportunities, and there will always be explosive stocks even of the market is not. In the spring and summer months, range-trading can also be effective, yet longer-term (albeit slower) trends can be found if you look at the sector charts - which can then be sued to find individual stocks.
In the meantime, the short-term averages (10- and 20-day lines) are likely to be the critical indicator lines, while support and resistance levels are likely to remain reversal points. Stochastics may prove particularly useful in the very near future.
Price Headley is the founder and chief analyst of BigTrends.com.
|