| A Primer on Moving Averages |
| By Andy Swan |
Published
04/13/2007
|
Currency , Futures , Options , Stocks
|
Unrated
|
|
|
|
A Primer on Moving Averages
One of the most versatile and widely used of all technical indicators is the moving average. The way it's constructed and the fact it's so easily quantified and tested lead way to it being the basis for many mechanical trend-following systems being used today.
Unlike chart analysis, which is subjective, difficult to test, and subsequently hard to computerize, the moving average can be easily programmed into the computer resulting in specific buy and sell signals. Two stock traders or option traders using technical analysis may disagree as to whether a given price pattern is a triangle or a wedge, or if the volume pattern is on the the bull or bear side of the market, but moving average trend signals are always precise and not open for debate.
Let's define what a moving average is. As implied by its name, it is an average of a specific body of data. As an example, our trader wants a 10-day average of the closing prices, so prices for the last 10 days are added together and the total divided by 10. Moving means the information changes with each subsequent entry. Since we are working with a 10 day average, each new day's closing price will be added, the 11th day back will be subtracted, and the new total is divided by 10.
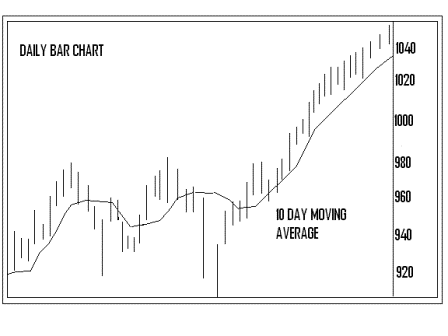
There are three types of moving averages - the simple, the linearly weighted, and the exponentially smoothed. The purpose of all three is to track and signal trend movement. Below is a rough graph showing the use of a 10-day moving average.

The Simple Moving Average, or arithmetic mean, is the most common moving average used by stock traders utilizing technical analysis. There are, however, some who question its usefulness. The two basic criticisms are; one, only the period covered by the average (the last 10 days, for example) are taken into consideration, and two, the simple moving average gives equal weight to each day's price. Instead of each day receiving equal weight, some traders believe the more recent price action should receive a heavier weighting.
The Linearly Weighted Moving Average is often used in an attempt to correct the weighting problem. It is more complicated to construct. Let's use our 10-day moving average as an example. Using this type of moving average would see the 10th day multiplied by 10, the 9th day multiplied by 9, the 8th by 8, etc. The total of each day is added together, and then divided by the sum of the multipliers. In the case of a 10-day moving average, the dividing number would be 55 (10+9+8+...1). The linearly weighted moving average takes care of the weighted issue, but does not address the concern of using only the covered period in the calculations.
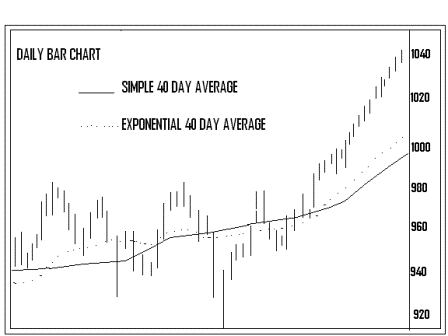
The Exponentially Smoothed Moving Average addresses both the criticisms of the simple moving average. It is a weighted moving average because it assigns a greater weight to the more recent data. It assigns lesser importance to the past price data, but it does include it in its calculation of all data in the life of the instrument. Also, it allows the user to adjust the weighting given to the most recent day's price by assigning a percentage value to the last day's price which is added to a percentage of the previous day's value. The percentage values of both would total 100. Let's say we assign the last day's price 10% (.10) of the total weighting, and add it to the previous day's value of 90% (.90). Giving the last day's weighting of 10%, it would be the equivalent of a 20-day average. If our day trader or option trader gives the last day a lesser value, say 5% (.05), the average is less sensitive and makes it the equivalent of a 40-day average. See the graph below which roughly shows how the the 40-day exponentially smoothed moving average is more sensitive than the 40-day simple moving average.

Using the computer makes plotting the moving average very easy. All our trader has to do is choose the number of days he wants in the moving average - 10, 20, 40, etc. Then he selects they type of moving average he wants - simple, linearly weighted, or exponentially smoothed. He can even elect to use one, two, or all three. How much simpler could it get?
The most statistically correct way to plot a moving average is to center it by placing it in the middle of the time period it covers. A 10-day average would be placed five days back, and a 20-day would be plotted ten days back. Centering the average carries with it the major flaw of producing much later trend change signals. Therefore, instead of being centered, moving averages are usually placed at the end of the time period covered.
Andy Swan is co-founder and head trader for DaytradeTeam.com. To get all of Andy's day trading, swing trading, and options trading alerts in real time, subscribe to a one-week, all-inclusive trial membership to DaytradeTeam by clicking here.
|
|