|
Weekly Outlook in the Stock Market
NASDAQ Commentary
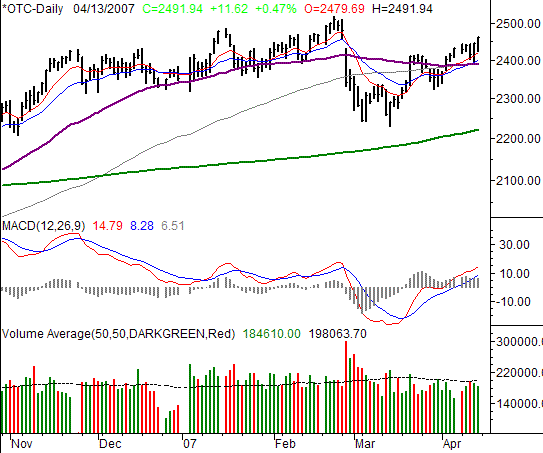
Friday's gain of 0.47% for the NASDAQ Composite matched that of the Dow. The composite gained 11.62% to end the week at 2491.94, which was 20.60 points ahead (+0.83%) of the prior Friday's close. The strong finish for the week suggests the bulls are going to remain vigilant here -- as we roll into earnings season.
First and foremost, check out the position of the and 20-day moving average line (red and blue, respectively) in relation to the 50- and 100-day lines (purple and gray, respectively). We have a new bullish crossover. We could theoretically end the conversation right there, despite never having made a typical full-sized dip, the prior uptrend seems to be back on track.
But, we do have something to add that supports the same bullish argument. Take a look at Thursday's bar. As of that point in time, this bullishness was still not a 'sure thing' (not that it ever is). Thursday morning when we were deep in the red, in fact, it looked anything but certain. The low of 2448.71 was back under the 10-day line, and pushing the support limits of the 20- and 50-day lines (as well as the 100-day line, which is a bit obscured on our chart).
Then, later on the day, a small miracle happened. The bulls turned what looked like was going to be a big loss for the day (as well as the week), and made it into a full recovery and then some. On Friday, they kept at it, pushing the NASDAQ to a new high for the week (2491.94), as ell as a new high for the past six weeks.
It seems a bit unbelievable, doesn't it? Yet, the rewards aren't necessarily reaped by the traders who can apply the most logic most of the time. It's almost always better to respond to what the market is doing until you have a clear reason not to. As of right now, the trend is bullish.
Yet, being skeptical can also be prudent. We're entering into one of the softest (usually) times of year - particularly for the NASDAQ. Though it's a bit premature to predict, do note when and if the composite finally breaks under the conglomeration of its key moving averages. Right now, that 'zone' is between 2440 and 2450. If they do break as support - which is a distinct possibility - there aren't a lot of floors in place until you get to the 200-day line at 2324.
By the way, we still haven't seen any strong volume behind this buying. That remains our red flag.
NASDAQ Chart

S&P 500 Commentary
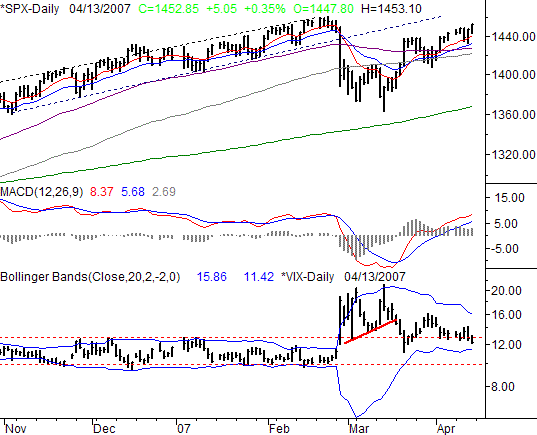
The S&P 500's close of 1452.85 on Friday was the result of a 5.05 point gain (+0.35%). For the week, the average large cap stock moved higher by 0.63%, as the SPX rose 9.10 points. As a result, the bulls now have a much more impressive foundation to work with.
All the technicals we mentioned for the NASDAQ Composite? Insert them here for the SPX chart, short-term lines are back above the long term lines. The only key difference here may be the support zone. It's a bit wider than the NASDAQ's. If the SPX falls under 1422 (the lowest portion of the 1422-to-1432 support zone), then we cold have trouble.
On the flipside, notice how close we are to making a new multi-year high. We peaked at 1461 in late February, only to run south again in a hurry a few days later. But, being persistent if nothing else, the bulls put their foot down and started forcing stocks higher again. Currently at 1452.85, we're less than 10 points away from new highs for this particular cyclical bull.
If we can break past that level with a couple of consecutively higher closes, then look out above. This market could come off the chain, perhaps repeating the kind of move we saw in the second half of last year.
That, however, is a big "if."
Our biggest worry for the bulls - and our strongest support for the bears - is a potential double-tip around 1461. The market has a way of finding its way back to levels just barely strong enough to give a few folks a second chance at getting out at the same area they should have previously gotten out at. In this case, that is 1461. And then, after the window of opportunity opens just for a moment, it can shut again very quickly.
So, while we're impressed by the recent runup, we still strongly advise caution until we clear the 1461 hurdle, if we even get a chance to.
In the meantime (and as something of a counter-argument), the VIX is back in it downward groove, closing at 12.20 last week. That was a three-week low. The lower Bollinger band line is at 11.38 and falling, which will allow some time and room for the market to creep higher until the VIX finds support. As always, we recommend using the VIX and the SPX chart in conjunction, as they both often hit their extremes (and reversal points) simultaneously.
S&P 500 Chart

Dow Jones Industrial Average Commentary
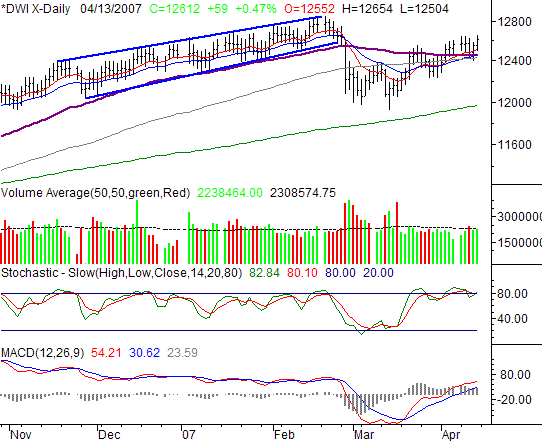
On Friday, the Dow Jones Industrials gained 59 points to end the day at 12,612. That 0.47% gain left the blue chip index just 52 points above the previous week's close -- a net of 0.41% for the five trading days. Along the way, a few more of the important buy signals were clinched.
Ditto for the Dow -- literally. The line in the sand here is 12,431, the lowest points of the combined 10-, 20-, 50-, and 100-day averages.
We've added a stochastic chart to the Dow's graph simply to illustrate how we're now into overbought territory. This could dampen the buying spirit, and is one of the primary reasons we're concerned the bulls may be at the end of the line. Of course, we were overbought for most of the second half of last year, and the Dow kept raging higher So maybe it's nothing to worry about.
Dow Jones Industrial Average Chart

Price Headley is the founder and chief analyst of BigTrends.com.
|