NASDAQ COMMENTARY
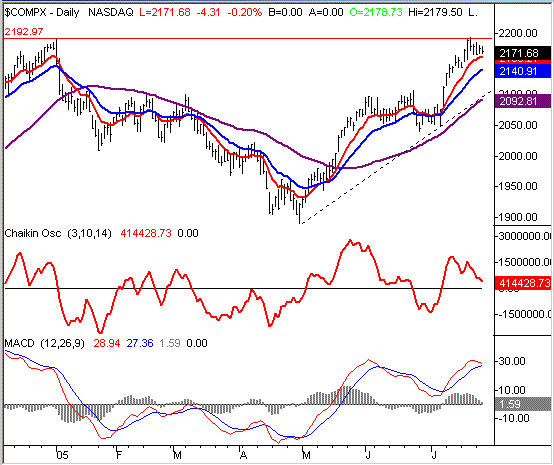
Last Thursday, the NASDAQ Composite hit a high of 2193.19. If that number rings a bell, it should - that's basically where the market topped out on the first trading day of the year. The precision with which the index hit that level for the second time, and weakened again, is at least a red flag. The most likely explanation is that a lot of investors and traders were waiting for the composite to reach these previous highs (which almost happened last Wednesday), then take profits before anybody else got the same idea. Unfortunately, everybody pretty much had the same idea. The selloff that started on Thursday led to the highest volume day we've seen in a while, and the composite has been sinking ever since. Now that resistance hasn't been broken, the lack of buyers means continued weakness is probably going to prevail.
The flipside of that idea is just that the NASDAQ is still above all the key moving averages, and is still in a technical uptrend. Despite the fact that we don't think that will be the case for too much longer, we have to respect the trend until we have specific reasons not to. With that, let's take a look at what is almost bearish about the NASDAQ Composite's chart.
Today we're just plotting a Chaikin line and a MACD chart. You'll recall that the Chaikin line simplifies the price-to-volume trend by putting that trend into one piece of data. For us, the buy/sell signal is just a cross above or below zero. As the chart shows, the Chaikin line has been falling for days, as the volume turned from bullish to bearish (even though stocks have been flat). However, the Chaikin line is still above zero, so we can't quite be bearish yet. The same basic scenario applies to the MACD chart. The faster MACD line (red) has clearly rolled over, and is pointed into the slower line. The technical sell signal will occur when the faster one crossed under the slower one, indicating that the direction of the momentum has shifted. But again, it hasn't quite happened yet.
Even the most important piece of the puzzle (price) has yet to actually turn bearish. As we said above, the composite is still above the key moving averages. The one we're watching most closely is the 10 day line (red). It's currently at 2163....just a few points under the NASDAQ's current level. The challenge here is that we don't yet know if it's going to be support or not. The index hasn't touched it since early July, so there's not really any frame of reference. The bullish momentum has been stopped, but until the composite actually falls under that line we can't be bearish....even though all the other signs are.
NASDAQ CHART

S&P 500 COMMENTARY
We've got two looks today at the S&P 500 chart. One is a short-term daily chart, and the other is a long-term weekly chart.
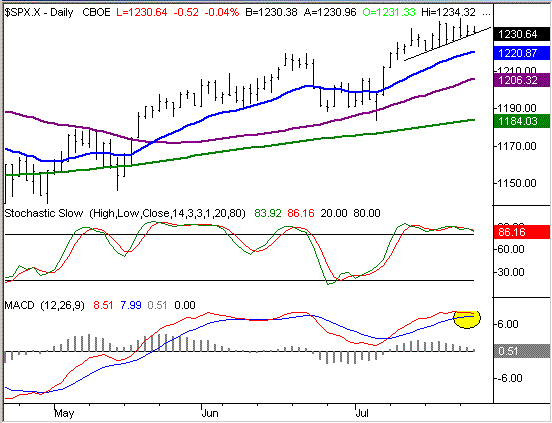
On the daily chart, the analysis for the S&P 500 is about the same as the NASDAQ's; despite all the bearish hints starting to pop up, the index has yet to die. Although it's not shown on our chart, the SPX is still above its 10 day average as well. The 10 day line is currently at 1227.50, and with the index currently at 1231, the two are close enough to keep things interesting through the rest of the week. The MACD lines here are also on the verge of giving us a sell signal, and it's also clear that we're stochastically overbought, and that's starting to take a toll. But as with the NASDAQ, unless the 10 day average actually fails to act as support, we can't be too bearish just yet.
What we really want to focus on here is the ultra-short-term support line traced by the lows over the last eight days (including today). This is not likely to be a line many people are watching, so it hasn't been established consciously. However, it's a very real factor....and very near. That support is currently at 1230, and rising quickly. If this support should break today, that could let stocks slip a little, or be the beginning of a bigger slide - we just don't know. If for some reason it holds up as support today, be sure to raise that level for tomorrow; we suspect we'll be seeing this line come into play eventually.
S&P 500 CHART - DAILY

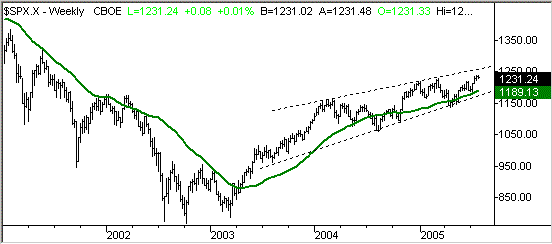
As for the longer-term, we're still pretty bullish. The short-term dip is just that....short-term. On our weekly chart, it's still clear that the S&P 500 is in a bullish trading channel. It just so happens that we're at the top of the channel right now, and are due for a brief correction. That lower support line is currently at 1171 (and rising), which is even below the 200 day average (green). Normally we'd be concerned to see the index cross under the 200 day line, but the last two tumbles under it were both quickly undone. So, that's not a major cause for long-term alarm if we see it happen again. The upper edge of this channel is at 1257. Note that we didn't get anywhere near that line with this most recent surge, so there's still a lot of room for upside movement no matter what happens in the near-term.
S&P 500 CHART - WEEKLY

DOW JONES INDUSTRIALS COMMENTARY
We've got just a couple of quick notes on the Dow, only because a lot of the bearish things that we mentioned could happen with the other indexes have actually already happened with the Dow (this is one of the reasons we're leaning towards bearishness before the market actually starts to sink).
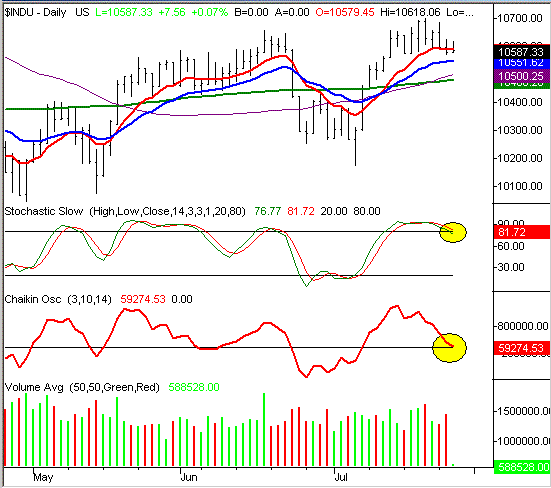
The Dow Jones Industrial Average closed under its 10 day average yesterday. That in itself isn't enough of a bearish sign for us to make a bearish call though. We need to see a lower close (lower than yesterday's close of 10,579.77) to act as confirmation. That confirmation, though, may come today. The 10 day average is currently at 10,590. Even though the Dow has been as high as 10,618 today, the open as well as the current price are both under the 10 day mark. Obviously it's not a sign of strength.
The Dow is also poised to create a few sell signals of its own. The Chaikin line is just a hair above the zero line, and any negative close (a loss of any degree) today will pull the Chaikin line under zero, and complete that sell signal. We're also near a stochastic sell signal too. Like the Chaikin signal, any loss for the Dow today will pull the second of the two stochastic lines under the 80 'overbought' line. That's our official sell signal for the stochastics indicator. However, like we said above, all of these bearish hints are dependant on the Dow actually making a lower close. Yesterday's close was 10,579.77.
DOW JONES INDUSTRIALS CHART - DAILY

Price Headley is the founder and chief analyst of BigTrends.com.