| Understand Continuation Patterns |
| By Andy Swan |
Published
04/17/2007
|
Currency , Futures , Options , Stocks
|
Unrated
|
|
|
|
Understand Continuation Patterns
Continuation patterns differ from reversal patterns in that continuation patterns usually indicate that the sideways action seen on a chart is merely a pause in the prevailing trend. With the reversal pattern, we know a major trend reversal is at hand. However, the next move after a continuation pattern will be in the same direction the trend was moving previously.
Another difference between the two types of pricing patterns is the time duration. Reversal patterns take longer to build and culminate in a major trend reversal. Continuation patterns are usually shorter in duration and are classified as term or intermediate patterns.
The word "usually" is used frequently here because in pricing patterns there are no rigid rules only general tendencies. There will be exceptions. Take triangles for example. Triangles, which are usually a continuation pattern, can act as a reversal pattern on occasion. They are usually intermediate, but at times they can be seen on longer term charts. The head and shoulders reversal pattern is a pricing pattern which primarily indicates a trend reversal, but can, at times, be merely a continuation pattern.
Pricing patterns generally follow their normal course of action, but the trader needs to allow for a certain amount of ambiguity and the occasional exception. Afterall, the success of the trader lies in his ability to interpret the signals provided.
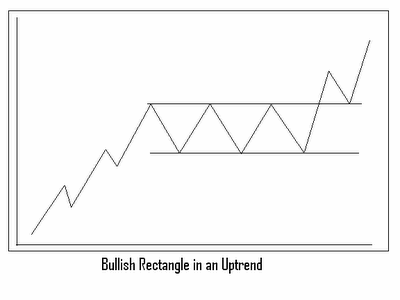
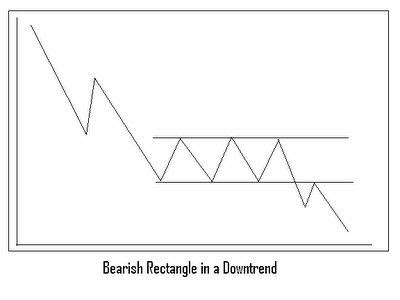
The rectangle is also referred to as a trading range or congestion area. It's easy to spot on a price chart and represents a pause in a trend during which the prices are moving sideways between two parallel horizontal trendlines. See the graphs below for examples.


No matter the name used, this formation usually depicts a consolidation period in the existing trend and is usually in the direction of the preceding trend. It's forecasting ability is similar to the symmetrical triangle except that the trendlines of the rectangle do not converge as they do in the symmetrical triangle.
A decisive close outside either the upper or lower line signals the completion of the rectangle. The trader needs to remain alert to be sure this formantion doesn't result in a trend reversal. He or she could view this pattern in an uptrend and think it could be a top reversal.
One important thing to watch in this formation is the volume pattern. Our trader will see fairly broad price swings in both directions, but needs to note which moves have the higher volume. It's most likely a continuation pattern if the rallies are on heavier volume and the set backs are lighter. A warning sign of a possible trend reversal is when the heavier volume is on the down side.
Some traders trade the swings within the rectangle by buying on the dips and selling on the rallies. Short term traders, like those who are Day Trading, can take advantage of this technique and profit from this trendless market move. Here, in the extreme of the range, the risks are relatively small and well defined.
Our Swing Trader may assume the rectangle is a continuation pattern, and decide to take a long position near the lower end of the price band in an uptrend or a short position near the top of the range in a downtrend. Our Option Trader may avoid this trendless market altogether and wait for a clearcut breakout before committing to a trade. Most trend following systems perform poorly during a sideways or trendless market.
The rectangle, like the triangle or wedge, takes 1-3 months to form, but the rectangle's volume differs in that its broad price swings prevent the usual dropoff in activity.
The most common measuring technique is based on the height of the pricing range. Measure the height completely from top to bottom, and then project that vertical distance from the breakout point. This is similar to other vertical measuring techniques used in continuation patterns and is based on market volatility.
With the upper and lower boundaries being horizontal, the support and resistance levels are clearly evident. So on upside breakouts, the top of the former price range provides support for any sell offs. On downside breakouts in a downtrend, the bottom of the trading range, the previous support, now provides a ceiling over rally attempts.
Andy Swan is co-founder and head trader for DaytradeTeam.com. To get all of Andy's day trading, swing trading, and options trading alerts in real time, subscribe to a one-week, all-inclusive trial membership to DaytradeTeam by clicking here.
|