| A Mid-Week Look at the Market |
| By Price Headley |
Published
04/19/2007
|
Stocks
|
Unrated
|
|
|
|
A Mid-Week Look at the Market
NASDAQ Commentary
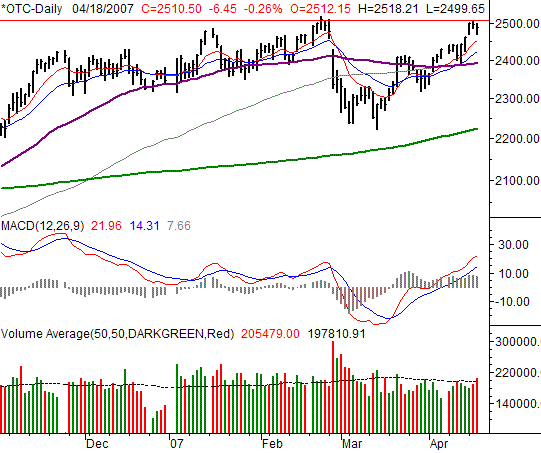
Through Wednesday, the NASDAQ Composite is up by 18.56 points (+0.74%), closing at 2510.5. That's despite a 6.45 point (-0.26%) loss yesterday, after hitting a peak of 2522.07 on Tuesday. The NASDAQ so far has been hitting an invisible ceiling around 2525. Was the uptrend just quietly ended?
There's really not a lot to add here. Until we get to new highs, we really don't want to assume the bullish move is going to be sustained. On the other hand, it won't take much of a move to make it happen -- about 20 points or so.
The only meaningful thing we can comment on here is simply how the 10- and 20-day averages have crossed back above the 50- and 200-day lines. But, that was a point we made a few days ago. So, nothing new there.
As for support, the combined 50- and 100-day lines at 2445 are the levels to watch out for.
NASDAQ Chart

S&P 500 Commentary
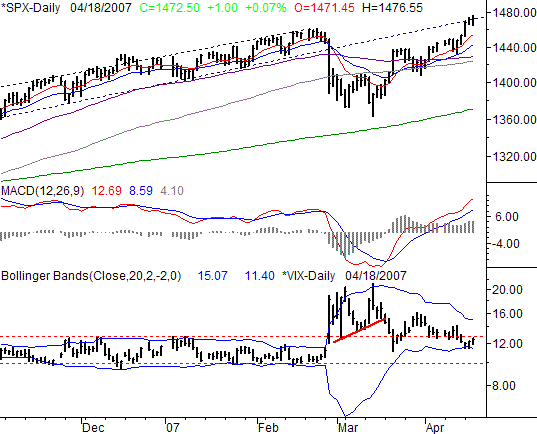
The S&P 500 remains the only index to move well past previous highs, by hitting a high of 1476.55 on Wednesday before settling in to close at 1472.50. That was 1.0 point (+0.07%) above Tuesday's close. On a weekly basis, the SPX is up 19.65 points, or 1.35%, thanks mostly to Monday's rally.
Guess what? The VIX that's been as helpful as watching the market itself has just hinted at a downside reversal for the market. Take a look. On Monday, it hot the lower Bollinger band, found support, and has been finding support ever since then. On Wednesday, it finally pushed up and off the lower band line. What's up with that? At the very least it should be a concern -- especially considering this is as far away as we've seen the SPX above its 10- and 20-day averages (red and blue lines) since August. (It's true - look closely.) That's why we remain so skeptical.
In a slightly different light, note how closely entwined all the average lines were (except the 200-day line). Thanks to the major stumble in late February, the market managed to collect itself, and consolidate. So far we've come out of the consolidation mode in a bullish manner. Hence, the bullish divergence in the moving average lines. But, it's not a foolproof indication. The only point we're making is now that the market has 'regrouped' a bog and prolonged move isn't entirely out of the question.
The problem is, beginning in May, we're supposed to be entering a tepid-to-weak time of year. To a large degree, that goes against the grain of the current picture.
Again, we're not assuming anything - just shedding light on the reality of the odds.
S&P 500 Chart

Dow Jones Industrials Commentary
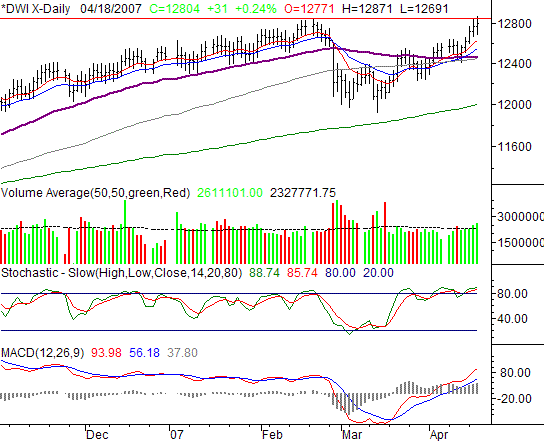
The Dow's 31 points gain (+0.24%) on Wednesday left it at 12,804. That was a new high close for the year, as was the high of 12,871. However, we're still not really 'over' the hurdle, so to speak. For the week, we're up 1.52%, or 192 points. More than that, the bullish momentum looks almost perfect. Could it be too perfect to be real?
The discussion we had about the S&P 500's consolidation of the moving averages acting as a 'reload' for the market? It applies here as well. So does the NASDAQ's discussion about failing to actually reach new highs fort he year, despite a pretty bullish last four weeks. Talks about a coin toss!
One nuance we have observed that nobody else has mentioned, had it not been for April 11th's loss, the Dow would have made 14 consecutive gains. To our knowledge, it's never been done before.
Other than that, we can add nothing here. We remain trapped between a rock and a hard place. The upside is, we're teetering right on the inflection point. With expiration only two days away, we may not get a definitive decision this week. But by next week, we expect to see a raging bull or an angry bear.
Dow Jones Industrials Chart

Price Headley is the founder and chief analyst of BigTrends.com.
|