| Weekly Outlook in the Stock Market |
| By Price Headley |
Published
04/22/2007
|
Stocks
|
Unrated
|
|
|
|
Weekly Outlook in the Stock Market
NASDAQ Commentary
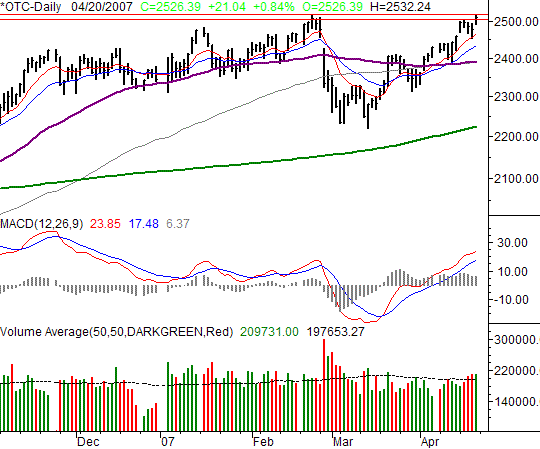
On Friday, the NASDAQ Composite added 21.04 points to its tally (+0.84%) to end the session at 2526.39. That translated into a weekly gain of 1.38%, or 34.45 points. Perhaps more importantly, Friday's high of 2532.24 was just a hair higher than February's peak of 2531.42. For our intents and purposes though, they're one and the same.
We're going to devote most of the space this week to the S&P 500 and the Dow, but there are a couple of things to mention about the NASDAQ's chart. First and foremost, unless 2532 is broken and stays broken, we'd have to say we can't justify getting overly bullish from here. If the rally is for real, we'll know in about 6 points or so. We may as well wait for the next hurdle to be crossed.
Second, the NASDAQ's failure to lead this recent rally remains a red flag. Volume here has been weak as well -- not what you'd expect when investor are feeling optimistic.
Yet we can't deny the momentum is still to the upside for the time being. We'd say keep a line on the 10-day line (red) at 2497 as the make-or-break level, and the 20-day line at 2475.
NASDAQ Chart

S&P 500 Commentary
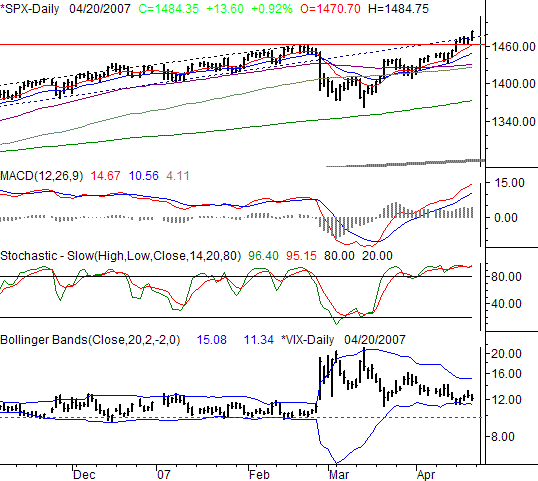
The bulls just couldn't get enough of the large caps on Friday, leaving the S&P 500 at 1484.35 thanks to a 0.92% (13.60 point) gain -- the close was essentially the same as the high of 1484.75. Both were new multi-year marks. Can it be too good to be true? The picture is a bit mixed right now, but we're not ruling out the possibility that more of the same could be in store.
We discussed a few days ago how the SPX hasn't been that far above its 10- and 20-day average lines since the middle of last year. Well, that problem was quietly solved last week with a tepid Tuesday-through-Thursday, allowing the 10- and 20-day lines a chance to catch up. Hence, the concern is cancelled.
And, we also mentioned that being stochastically 'overbought' could weigh in on the market. However, having been overbought for about three weeks now, that worry is waning too,
What we're left with is upside momentum. Note that the S&P 500 has made its way back above a very long-term support line (dashed). In that light, the recent rally doesn't seem so unreasonable. It just makes March seem like a normal correction, and now we're back on track.
More than that, note how the moving averages are starting to show us a bullish divergence again after a consolidation in late March. Its' reminiscent of the consolidation we saw in June of last year -- right before an unprecedented runup. So, we're not ruling anything out.
The trick will be in what happens once the market is really challenged If a couple of strong selloffs jump-start bigger problems, then the market's vulnerability will be exposed. If the bulls flight back and keep the index hoisted up at the moving averages lines then yeah, this market may indeed go higher.
In the meantime, patience is merited until we get that vital clue.
S&P 500 Chart

Dow Jones Industrial Average Commentary
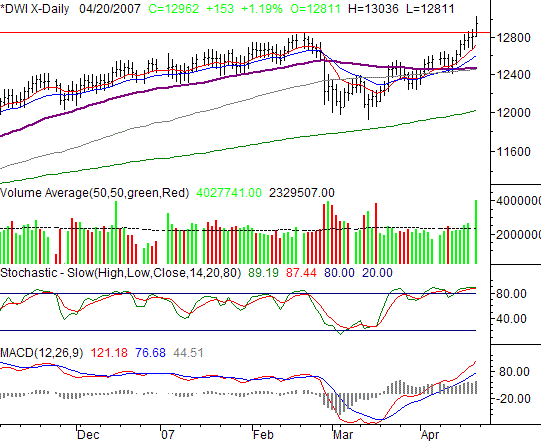
The Dow's high of 13,036 on Friday was a new all-time high, while the close at 12,962 was a new all-time high close. The feats followed a 1.19% rally, or 153 point gain. On a weekly basis, we saw a 2.78% gain for the Dow, as the index closed 350 points higher than the prior week's close. For the day and the week, the Dow led the charge. Yet, Friday's strength is actually a bearish concern most notable with the Dow.
We know we probably sounded more bullish than bearish in the above discussion. And, based on momentum, we mostly are bullish, However, the Dow's chart highlights the concern - and the type of concern - we currently have.
We already know the rally on Friday was huge. It was also the 15th day of the last 16 that we saw gains, very unusual indeed. To top it all off, the volume was remarkably stronger behind Friday's buying than it had bee in weeks.
Too good to be true? That's the concern. We have to wonder if Friday was some sort of culminating blow-off top. Though not as extreme as the typical single-day blow off, we also have to consider the market has been doing almost nothing except buying for the last three weeks. Eventually, the buyers have to run out of money. We have to wonder if the last hurrah for a while was just seen.
Just something to keep in your back pocket this week.
Dow Jones Industrial Average Chart

Price Headley is the founder and chief analyst of BigTrends.com.
|