| The McMillan Options Strategist Weekly |
| By Lawrence G. McMillan |
Published
04/27/2007
|
Options
|
Unrated
|
|
|
|
The McMillan Options Strategist Weekly
To say that this market has been strong would be a gross understatement. This most recent strength started with last week's option expiration where arbitrage-related buying was stronger than many had expected. Even we -- who had been pointing out the likelihood of buy programs were somewhat surprised by the pure strength of buying on both the open ($SPX) and the close ($OEX) last Friday. Then, this week, one would figure that there might be some "expiration hangover" selling, but it was short-lived as attention quickly turned to end-of-the-month buy programs (window dressing). It seems, in fact, that there are just a lot of a) shorts and b) under-invested longs who turned negative during the mini-crash at the end of February and have not yet gotten fully back in. This is a powerful force, and with the month-end approaching, there will be a calling to account.
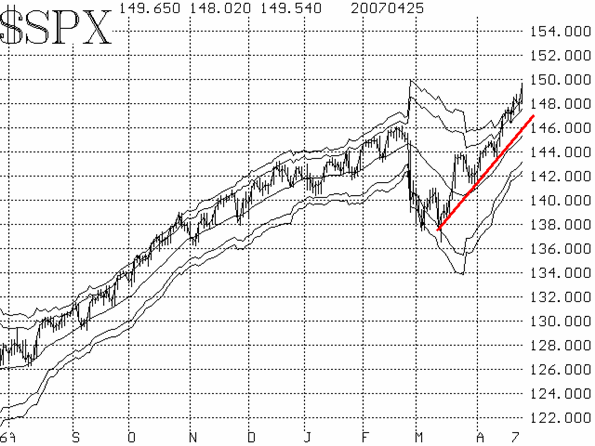
The $SPX chart is a bullish one. The upward trend line is the true demarcation line for this bull market now (see Figure 1). As long as $SPX remains above there, the intermediate term outlook is bullish. In the short term, $SPX has risen above the upper Bollinger Band, and that is an indication of an overbought condition -- but not an overly worrisome one. You can see from the graph that $SPX crawled along the upper band for much of last year, occasionally drifting sideways and slightly down to touch the 20-day moving average and then moving higher again. That same sort of action could be repeated now, without any real harm to the intermediate-term bullish case. Now that $SPX has approached the 1500 level, it seems likely that it will go ahead and challenge its all-time highs at 1550.

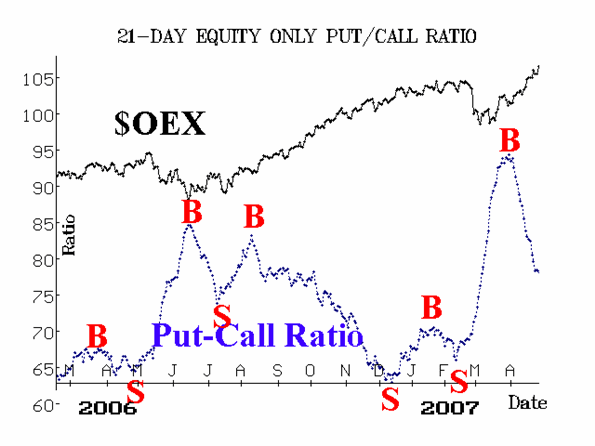
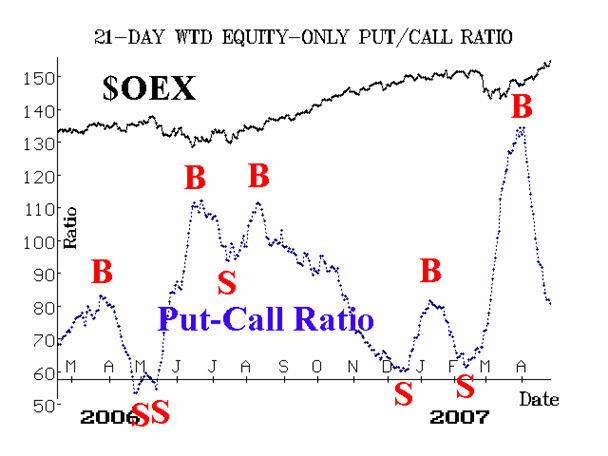
The equity-only put-call ratios remain bullish (Figures 2 and 3). They mostly turned bullish right near the beginning of April -- at about the same time that $SPX was successfully testing the 1410 support level. The extreme levels from which those buy signals came (i.e., they were high on their charts) foreshadowed the intermediate-term strength of this rally. The ratios have declined substantially since then, but they will remain on buy signals as long as they continue to decline.

Market breadth has generally been strong, although there were a few days when the Dow and $SPX were up, but breadth was negative. That kind of divergence is often a warning of a negative move, but not this time. Rather, what actually happened, was that the negative divergence in breadth alleviated the then-overbought condition, allowing this week's rally to take place without creating a severely overbought condition.

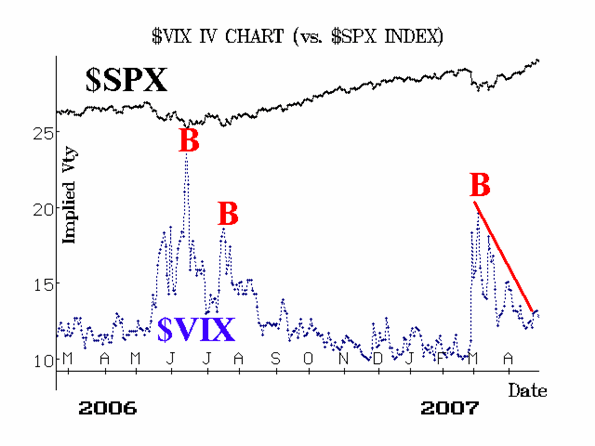
Finally, the volatility indices ($VIX and $VXO) have edged higher. This short-term rise in $VIX has not proven to be a problem for the rally either, so there is a chance that we are entering one of those bullish periods where volatility increases. They've occurred in the past, but not since the late 1990's.

In summary, the indicators are on buy signals or at least are conducive to further upside moves. The overbought nature of breadth and $VIX might be calling for a short-lived correction, but we would not expect it to be significant. There are still plenty of traders who need to get long(er), and they are buying into every small decline.
Lawrence G. McMillan is the author of two best selling books on options, including Options as a Strategic Investment, recognized as essential resources for any serious option trader's library.
|