| Is the Stock Market Topping Out? |
| By Price Headley |
Published
04/27/2007
|
Stocks
|
Unrated
|
|
|
|
Is the Stock Market Topping Out?
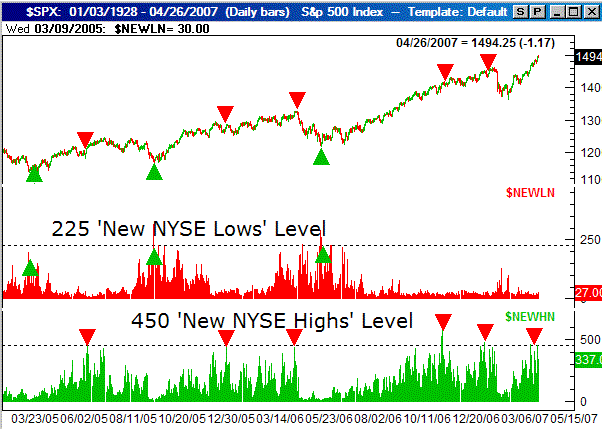
Long-time readers may recall the few instances we've examined a wild number of new NYSE highs and/or new NYSE lows as a potential reversal point. In general, when we start seeing new NYSE highs come in at or around 450, we've often observed that to be a market top. Conversely, when we see new NYSE lows total up to 225 or so, a bottom may be forming. As you may have guessed, we're seeing one of those scenarios right now.
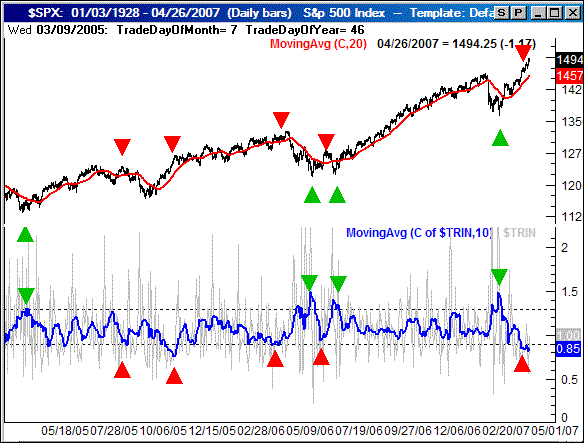
OK, first things first - a chart of the NYSE TRIN reading compared to the S&P 500. Yes, we know we looked at this only a week ago, but the bearish problem has grown. The 10-day average of the TRIN is now at 0.85. As the chart shows, this often occurs at a short-term top.
S&P 500 with 10-day average of NYSE TRIN

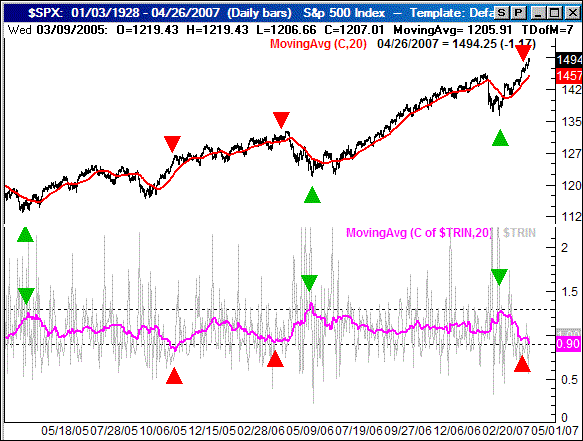
Take a look at the intermediate-term 55-day average of the TRIN. The last time we looked it was at 0.96, also unusually low for that length of time - and potentially bearish. Now it's at 0.90.
S&P 500 with 55-day average of NYSE TRIN

So, the breadth and depth picture is supposed to be bearish now. Of course, it was supposed to be bearish a week ago too, and no dice. Like we said, then, this isn't a dynamic we can blindly expect to take to the bank. However, the tendency is still evident.
Now, add this to the equation. On the weekly chart below, we've plotted the S&P 500 with the new NYSE low readings in read, and the new NYSE high readings in green. Instances where either hit an extreme are marked with arrows. And, more often than not, a reversal did indeed follow, or at least the trend at the time was ended.
Needless to say, last week's new high reading hit 460 last week, and hit 455 on Tuesday. Though not fool-proof, the history of this tool as a market reversal indicator is a little too good to just blow off.
S&P 500 with new NYSE high/new NYSE lows

So are we making the bearish reversal call? No, not yet. The market's momentum remains bullish, and we stick with the trend until it's clear we shouldn't. But boy-oh-boy is this a big vulnerability. To see one or the other would call any bull trend into question. However, seeing both at the same time right as we enter a time of year we know has been problematic in our recent past? Just makes you think.
We'll remain on our watch and let you know how these charts develop.
Price Headley is the founder and chief analyst of BigTrends.com.
|