|
Weekly Outlook in the Stock Market
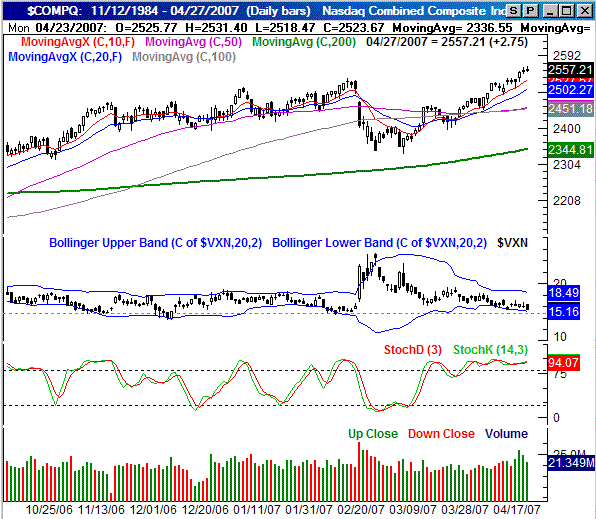
On Friday, the NASDAQ Composite hit another new multi-year high of 2562.99 before coming back to close at 2557.21 -- a 2.75 point/+0.11% gain. For the week, we saw a 1.22% improvement, thanks to the 30.82 point move. However, though the week was clearly a winner, the momentum as well as the bullish volume tapered off over the last three sessions. On the other hand, that volume was still above average.
The bull/bear argument is still heated. Let's explore both sides of the fence.
What's bullish? Momentum. We just hit new multi-year highs, and the volume behind those highs was better than it had been in weeks. There's really no denying that the bulls have remained in charge. And as you know, "the trend is your friend."
What's bearish? For lack of a better way of saying it, being too bullish is bearish. We've now been overbought (stochastically) since late March, and the market hasn't been able to stay overbought that long since September of last year. And like we said above, the buying volume tapered off in the latter part of last week.
The bottom line, however, is that you can't fight the trend. All the same, here's what we're looking at to signal all this bearish potential is likely to be realized.
Keep an eye on the stochastic chart (yes, we will for you). Once both of those lines cross back under 80, that may be the beginning of the end. Also - and just as importantly - watch for any closes under the 20-day line (blue) at 2502. However, note that even that sell signal has been a little shaky at best recently. Ideally, we'd like to say use the 50-day line (purple) as a bull/bear line in the sand. It's at 2453 right now. However, the NASDAQ would have to fall more than 100 points to get there, and we don't want to wait that long to take any bearish stance.
So, we may end up relying n the CBOE NASDAQ Volatility Index to make such a call. Unlike its S&P 500 brother, the VXN is close to support level around 14.80 again. Once we get a clear hint that it's trending higher again that may be the short-term beginning of the end for the market.
NASDAQ Chart

S&P 500 Commentary
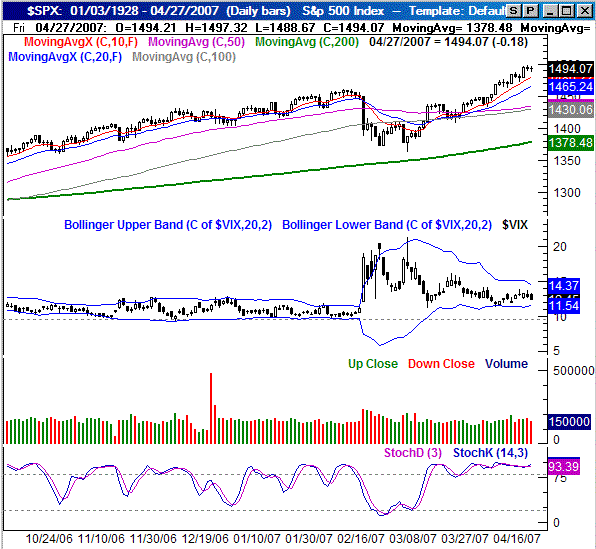
Friday's close of 1494.07 was 0.18 points under Thursday's close. However, on a weekly basis, the S*P 500 managed to gain 9.72 points, for a gain of 0.65%. Clearly the momentum is to the upside here, but perhaps by too much; we're way overbought here as well.
As we've discussed a couple of times recently, the SPX is now dangerously above it's 200-day line (green) again. In fact, it's 8.3% above the long-term moving average. Just as a reminder of what happened the last time we got this far ahead of ourselves, you don't have to look any further back than February 28. Though the over-extension alone wasn't the only contributing factor to the tumble, it certainly augmented the vulnerability.
One of the additional bearish arguments for the SPX is volume, or lack of, to be specific. Though the NASDAQ's bulls have come out in good numbers, the same can't be said about the S&P 500.
As with the NASDAQ, we can't really rely on the 10- or 20-day lines to act as a signal of any downside move. They just haven't been good signal lines lately. So instead, we're keeping watch over the VIX. Of course, at last look, the VIX was pointed lower, with plenty of room to move (from 12.45 back down to the support line around 9.60). In other words, the VIX says there's room for more market upside.
The point being, if the 10- or 20-day lines are succesfully retested as support, and the VIX isn't back at or near the mid-9 area, don't rule out any further bullishness, as unlikely as it may seem.
S&P 500 Chart

Dow Jones Industrial Average Commentary
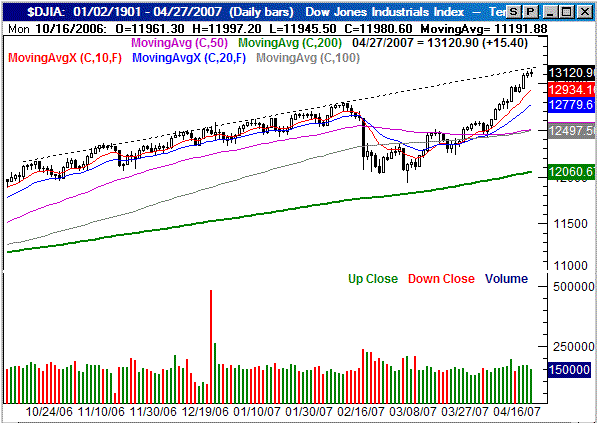
The Dow's new all-time high of 13,197 on Thursday was not topped on Friday - the DJIA only got up to 13,195 before settling in at 13,121. Still, that was a 15 point gain above Thursday's close -- up 0.11%. For the week, the Dow Jones Industrial Average put up a 1.23% gain, adding 159 points to its score. Still bullish - still stunning.
There's no point in repeating anything we said above about the NASDAQ or the S&P 500 - pretty much everything we said above can be said of the Dow as well. There is, however, one additional item to examine that's unique to this chart, and perhaps troubling for the bulls.
The long-term resistance line that guided the Dow higher (though by acting as a ceiling) in the last quarter of last year (and January as well)? It's back.
Good news? Well, that's all a matter of perspective. We see it more as an end of the road kind of thing. This line is plotted (dashed) on our chart today, currently resting at 13.171. If the resistance line fails to contain the Dow, then all we can say is that it's one uncanny breakout. However, if it holds the uptrend in place here, the bull's party may be over. That's not necessarily bearish, though it could be. A failure to move higher like it has been may leave traders uninterested, leading them to sell positions in what's already the traditionally weaker time of year.
Dow Jones Industrial Average Chart

Price Headley is the founder and chief analyst of BigTrends.com.
|