| Three Stocks Sectors To Watch |
| By Price Headley |
Published
05/2/2007
|
Stocks
|
Unrated
|
|
|
|
Three Stocks Sectors To Watch
Though the market has been bullish of late, we're mostly concerned with a handful or potential problems. We'll just touch on some of them today, but bear in mind none of these setups for pullbacks have actually started yet.
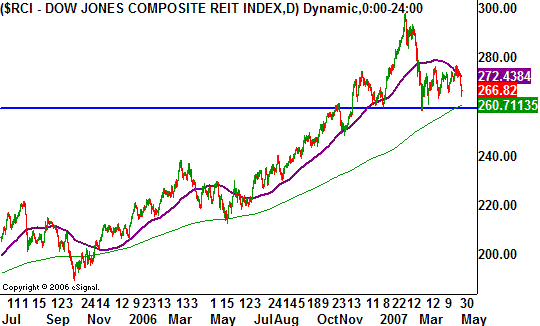
Could real estate finally be in real trouble? We see a head-and-shoulders pattern on the daily chart, along with a lot of potential downside.
Just to clarify, this has nothing to do with 'real estate' as an asset - this is strictly in reference to REITS. The head and shoulders may start in November of last year. The clincher to that pattern would be a move under the Dow Jones REIT Index (RCI) neckline at 259. That would also be a move under the 200-day line. Crosses under the 200-day line have been survived before, but the interest rate and economic growth environment are different now.
Some of the biggest REIT names are Vornado (VNO), Public Storage (PSA), and Equity Residential (EQR). (continued below)
Dow Jones REIT Index (RCI) - Daily

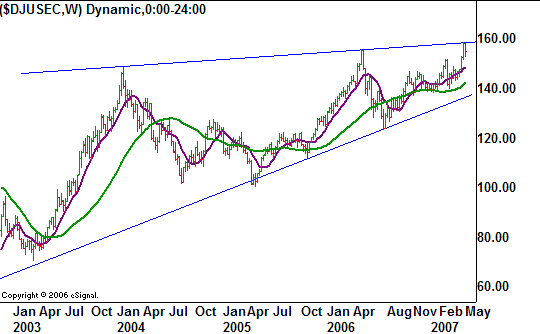
We're putting the Dow Jones Electrical Components Index (DJUSEC) on notice because of the apparent wedge shape just defined by the last two days of weakness. On the weekly chart below, you can see how that peak lines up with two previous nodes dating back to 2003. The last two brushes with that line pushed the index back to the lower edge of the wedge, currently at 138, but rising pretty sharply. Of course, that lower line has 3 highly-accurate nodes, and we've seen two more dips reach pretty close to that line over the last three years.
The implication so far is unclear. However, as of right now, the direction is bearish. The longer-term possibility, though, is uncanny. And make no mistake - it will have to happen soon, with the way the wedge is converging on itself. Till then, we're looking for a move back to the lower support line, which will be around 141 b y the time it's met. After that, we'll need to revisit the chart.
Dow Jones Electrical Components Index (DJUSEC) - Weekly

OK, enough is enough already. We were bullish based on this chart's momentum, but now we're thinking it maybe best to take it off the table. We just see too much vulnerability.
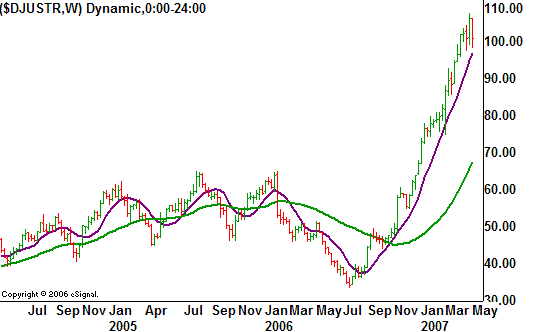
Since late July of last year, the Dow Jones Tires Index (DJUSTR) has rallied more than 200%. Nice move, but the last two days may have exposed a chink in the armor. Though not falling apart yet, we like the pullback potential here, though totally unrealized as of right now. The 50-day line is at 94. If it's breached, it's a long trip back down to the 200-day line at 64.0.
Cooper Tires (CTB) and Goodyear (GT) are the key players here.
Dow Jones Tires Index (DJUSTR) - Weekly

Price Headley is the founder and chief analyst of BigTrends.com.
|