|
Weekly Outlook in the Stock Market
NASDAQ Commentary
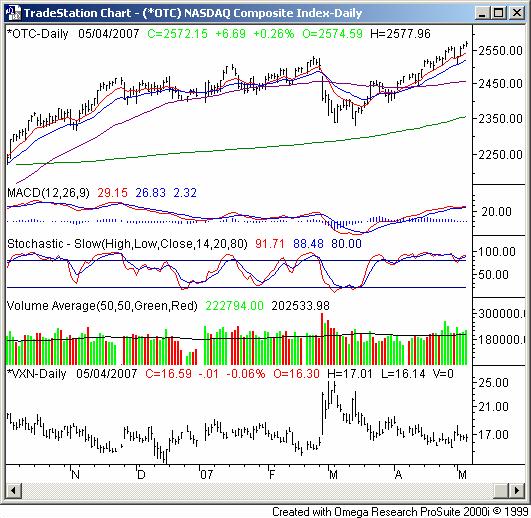
On Friday, the NASDAQ Composite hit yet another new multi-year high of 2577.96 before coming back to close at 2572.15. That was 0.26% (+6.69 points) above Thursday's close, and 0.58% above (+14.94 points) the previous Friday's close. It was the fifth consecutive winning week for the OTC. Despite its unlikely nature, the market seems to have some persistent momentum.
What can we say that we haven't been saying for at least a couple of weeks now? It's not really supposed to be this way, but the buying is undeniable. Above all else, the trend is your friend, right? We have to side with momentum, as frightening as that may be. Just be prepared for anything. It'll happen eventually.
OK, with the reality check in place, let's take a look at the NASDAQ's chart. What's bullish? MACD, five weeks of gains, and the growing volume behind the move suggests there may be more of the same in store. What's bearish? Being stochastically overbought, and an index that's 9% above its 200-day average (green).
The fact is the best recent shot the NASDAQ Composite had at falling apart was Tuesday's plunge to 2510.57, and that lasted about four hours. By the end of the day, thanks to the support at the 20-day average (blue), the composite closed a little higher for the day, and kept on putting up gains the rest of the week. Though it was small and subtle, that tiny one-day dip may have been enough to relieve the pressure, and act as a reload for the uptrend.
The move from March's low to here? That was a 10.3% run -- 241 points. That's big by most standards, and of course, sets up the possibility of a pullback (yet one more reason to be concerned). Yet, we now know we can't get overly worried until the 20-day line breaks as support. It's currently at 2522. Unless it breaks, the potential downside move will only remain potential.
By the way, the VXN isn't at problematic levels either. We're guessing it won't be 'too low; until it gets towards the mid-14 area. It's currently at 16.59.
NASDAQ Chart

S&P 500 Commentary
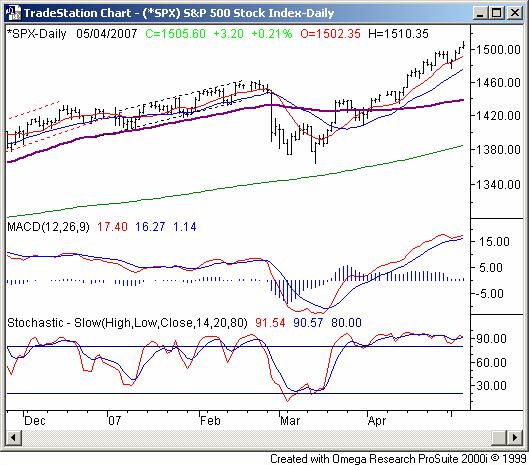
Friday's close of 1505.60 was 3.2 points higher (+0.21%) above Thursday's close. It was also 11.55 points higher (+0.77%) than the prior week's closing level -- the fifth consecutive winning week for large caps, and no apparent end in sight. Should we be nervous? Probably, but until at least half of the market is nervous enough to do something about it, "should" is irrelevant.
There's really not a lot to add here for the SPX. The themes are the same as the NASDAQ's.
As for the SPX particulars though, the 200-day line (green) is currently at 1385 -- 8.6% under the S&P 500's closing level. That, however, may be irrelevant unless the short-term averages start to buckle, which they haven't yet. Tuesday's pullback didn't even brush the 20-day line. Instead the SPX got about 8 points below the 10-day average (red) before rebounding for the rest of the week. From March's low to the current level was a 141 point move, or 10.3% worth of gain.
Though we're strangely well above the 200-day average, we'll also mention we're even over-extended above the 50-day line (purple). We haven't been 4.6% above since late 2005, and that ended in a pretty decent dip. So, either this bull run is an anomaly, or we're overdue for the correction we really didn't quite get in February. As it stands now though, it's an incredibly odd but bullish run.
S&P 500 Chart

Dow Jones Industrial Average Commentary
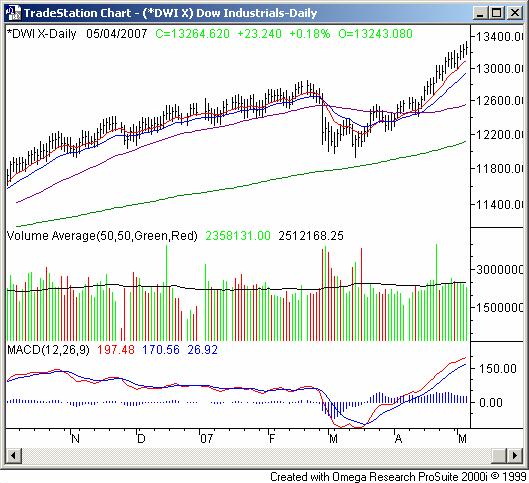
The Dow was the only index not to make a new 52-week high on Friday, which is a little suspicious considering these blue chips have been leading the rally so far. Their 23 point gain (+0.17%) on Friday was the weakest of all, though on a weekly basis the Dow is still leading the pack. It gained 143 points over last week's close -- a 1.09% improvement.
Would you believe this is the biggest uninterrupted seven-week rally the Dow has had since 2003, right after the bear had ended and the bull was beginning? It's true. From March's low, the DJIA has gained 1338 points, or 11.2%. The one from last fall put up a bigger results, about 15%, but lasted more than twice as long. That's impressive, but as you might imagine we'd say, is also a bit scary.
The Dow is 5.6% above its 50-day line (purple), and 9.4% ahead of the 200-day average (green). Both of those numbers are also suspicious.
Can the market keep it up at this blistering pace? It seems practically impossible, but it also seemed impossible about three weeks ago. To that end, we're watching the 10- and 20-day lines at 13,104 and 12,942.
Dow Jones Industrial Average Chart

Price Headley is the founder and chief analyst of BigTrends.com.
|