| Is Biotech Hitting a Wall? |
| By Price Headley |
Published
05/8/2007
|
Stocks
|
Unrated
|
|
|
|
Is Biotech Hitting a Wall?
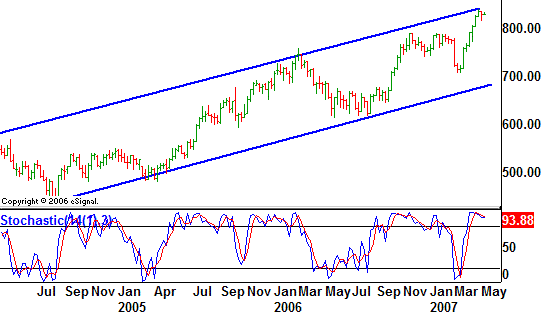
Though the market has been hitting new highs over the last two weeks, we find it suspicious that biotech stocks haven't. Instead, the AMEX Biotech Index (BTK) has made pretty consistent lower highs. Perhaps it's part of a longer-term pattern of major ups and downs.
On the weekly chart below, we can see the rising support and resistance zone that has kept the index in check since 2004. Having established a relatively predictable pattern, the recent encounter with the upper edge of the zone suggests the uptrend is near its end, and that a pullback is on the works. Being stochastically overbought (again) supports the argument.
Though not yet the ideal bear signal (we'd prefer a move under 815 to confirm), what we're looking for is a move all the way back to the lower edge of the zone, which would be at 710 or so before it was actually retested. The stop on this bearish bias, or course, would be a move above the upper resistance line, currently at 841.
AMEX Biotech Index (BTK) - Weekly

Updates on Recent Calls
Just wanted to give you the latest on a handful of other sector/industry ideas we've presented to you, as things have changed enough since then to merit a closer look (or action, if applicable).
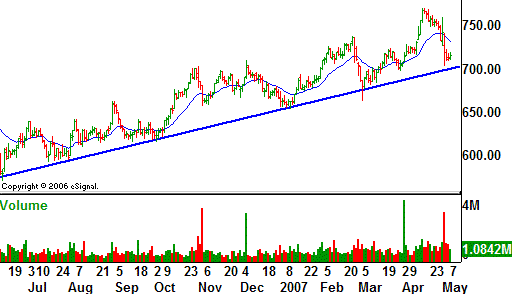
We know we've been bullish on water (utilities and infrastructure) a couple of times in recent months. And, these calls have been generally right - the Dow Jones Water Index (DJUSWU) has moved higher over the last ten months or so. However, it's been a roller-coaster ride between then and now.
As it currently stands, water stocks are sending a mixed message. The index has fallen from 769 in mid-April to the current reading of 715 -- a 7% slide that doesn't suggest a ton of strength. On the other hand, the selling appears to have stopped near what is materializing as a long-term support line around 700. So, we find the chart a bit at odds. We're not particularly pleased with the lack of consistent momentum - nor the taunting of that support line. However, we can't deny that a bounce off that support line could be a decent trade.
Point being, this chart is worth watching over the next few days, if only to see how things shape up. While a bounce would be a good trade, so too would be a bearish break under that support line.
Dow Jones Water Index (DJUSWU) - Daily

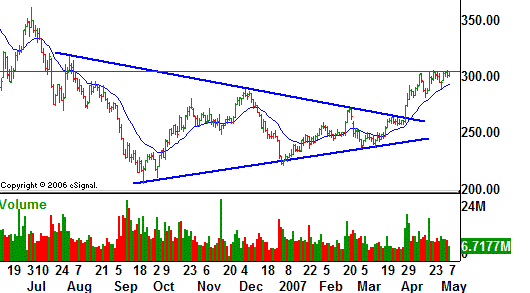
A few months ago, we were concerned that the coal industry's stocks were headed for another big tumble. A wedge was forming following the peak and pullback from the middle of last year, which generally suggests a downside continuation was looming. Well, the Dow Jones Coal Index (DSUSCL) surprised most everyone by breaking to the upside of that wedge, and moving from 263 to 304.
More of the same in store? Maybe. Maybe not.
Though we like the momentum, and the fact that energy as a whole seems to be moving higher again, we can't help but notice that this index hasn't traded above 305 yet, though it's had eight legitimate attempts to do so over the last eleven days. Is this ceiling the end of the road for the coal buyers?
So far, it looks like the answer is yes, but we still have to say we like the potential. A breakout move that's been building like this tends to be pretty explosive once it happens - if it happens. So, keep an eye out for a break above 305. It may trigger a bullish avalanche.
Dow Jones Coal Index (DSUSCL) - Daily

Price Headley is the founder and chief analyst of BigTrends.com.
|