| A Mid-Week Look at the Market |
| By Price Headley |
Published
05/9/2007
|
Stocks
|
Unrated
|
|
|
|
A Mid-Week Look at the Market
NASDAQ Commentary
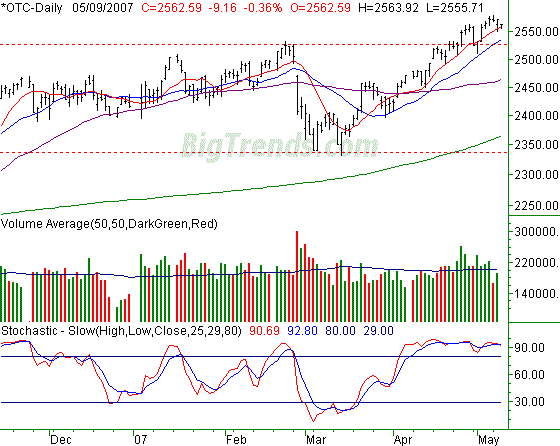
As of noon today, the NASDAQ Composite was lower by 0.36%, or -9.16 points, currently trading at 2562.59. For the week, that means the OTC is on the hole by 9.56 points, or -0.37%. You don't need a degree in calculus to figure out the index would be flat for the week were it not for today.
What can we say? The bulls won't give up. The best shot the bears had at getting something started was yesterday. However, that side trip was cut short at the 10-day moving average line (red) at 2555. Once it was reached, the buyers stepped in again and managed to push the NASDAQ back into the black. Today we're seeing the same thing: support around the 10-day line, and a bullish push off of it. The day isn't over yet, but the bulls appear to have retained control.
That said, we remain cautious. The feverish pace from a few weeks ago has tapered off, and the buying volume surges are getting smaller - not bigger. Weighing in on the index is being overbought for an excessively long time...to the point where the market is starting to set records. That's great while it lasts, but it never lasts forever.
As of right now, any bearish clue would come in the form of a close under the 20-day line (blue) - something we haven't done since March 21. It's currently at 2536.
NASDAQ Chart

S&P 500 Commentary
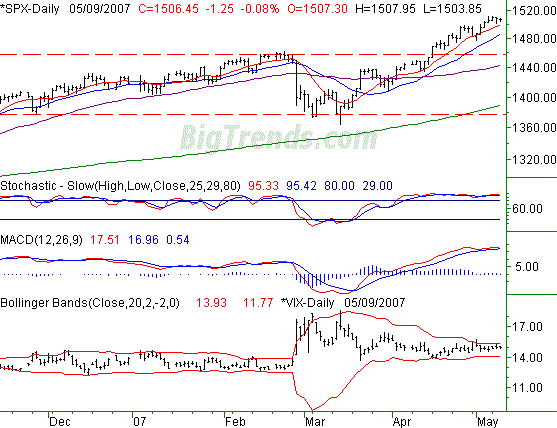
The S&P 500 is down 1.25 points, or 0.08%, so far today. That leaves the large cap index at 1506.45 at last look, which is still up by 0.06% (+0.85 points) for the week.
It's no secret we've been astonished at the market's recent resilience - so much so that we're perhaps a little anticipatory of the pullback that's now long overdue. Not that we have a problem with that....we're actually rather excited about the nice trading opportunities that could present themselves with a big correction (which are typically much more violent than rallies).
With that in mind, we'd like to be able to say these three tings are signaling the market's short-term demise.
1) The VIX is starting to trend higher, pushing above its upper Bollinger band
2) The SPX is spending more time under the 10- and 20-day lines than above them
3) The stochastic lines are finally under the 80 'overbought' threshold
The problem is, none of that is true. Hence, we still have no founded reason to get on the bearish side of the fence (even though we're fully prepared to do so at a moment's notice). Instead, here's what we see:
1) The S&P 500 seems to be finding support at the 10-day line
2) Nobody seem to have a probably with being stochastically overbought
3) The VIX is content right where it is - in a right range between 12 and 14
So, discipline dictates that we side with the current momentum, or at least be patient with any bearish trades. Do note that the MACD lines are painfully close to a bearish cross. If we get such a signal at the same time the VIX finally pokes above its upper band (and stays pointed that way), then we may finally get a pullback.
But, we at least need to see one key sell signal (MACD cross, index crosses under 20-day line) along with a VIX upturn to really say this incredible rally is over.
S&P 500 Chart

Dow Jones Industrials Commentary
Well, the Dow Jones Industrial's historical streak looks like it may be coming to a close, though that's far from a bearish view. The current momentum and recent track record are still uncanny by any standard, and we're continuing to respect that despite today's soft patch.
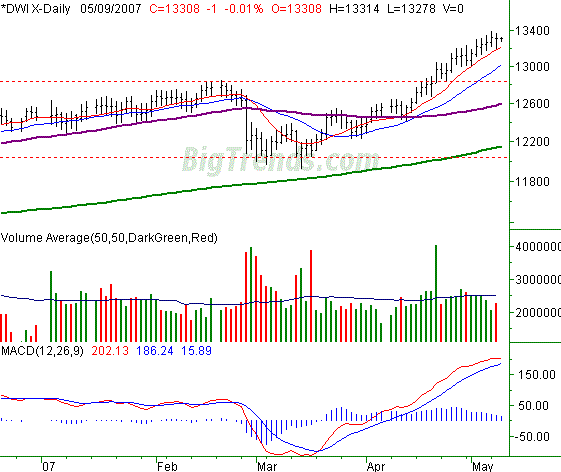
So far today, we see the DJIA is flat with yesterday, making a nice recovery from the low of 13,278. Compared to Friday's close though, the Dow also remains in positive territory, higher than Friday's close by 43 points, or +0.32%. And, the support at the 10-day line (red) has been near-perfect.
What we're not seeing, though, is any follow-through in terms of buying volume. And, the fervor seems to have lost some zip. No bearish call here yet though. The bulls still have the ball in their hands.
Just so you know, the Dow is now 9.5% above its 200-day line (green). That's also a monumental over-extension, reflective of the unprecedented runup we've seen over the prior seven weeks. And yes, that's a cause for alarm.
In the meantime, the bulls are still fighting. A close under the 10-day line (currently at 13,207) may start to unwind it, but that in itself wouldn't be enough of a sell signal for us.
Dow Jones Industrials Chart

Price Headley is the founder and chief analyst of BigTrends.com.
|