| The McMillan Options Strategist Weekly |
| By Lawrence G. McMillan |
Published
05/11/2007
|
Options
|
Unrated
|
|
|
|
The McMillan Options Strategist Weekly
A large decline finally materialized after about five weeks of solid gains. It had a bit of the appearance of "everyone trying to get out of the exit at once." In other words, there was a panic feel to the selling. When all was said and done, though, the damage to the intermediate-term picture was minor. But we will have to be vigilant to see if there is any follow-through.
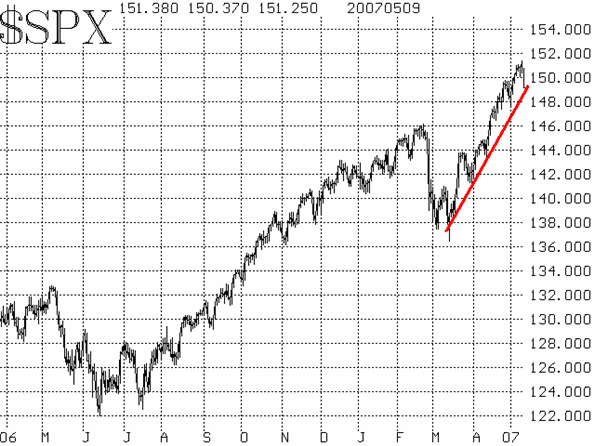
$SPX had made a series of new highs, as it crawled along the outside of the upper Bollinger Band. That is a tough pace to maintain, as the market is generally overbought at those heights. Thursday's selling alleviated that overbought condition, as $SPX pulled all the way back to its 20-day moving average in one day. This is also where the bullish uptrend line exists. Thus, so far, there has not been a violation of that important line. However, should $SPX close below support in the 1475-1480 area, we would have to downgrade the chart to short-term negative. At the present time, though, it remains an intermediate-term bullish chart.

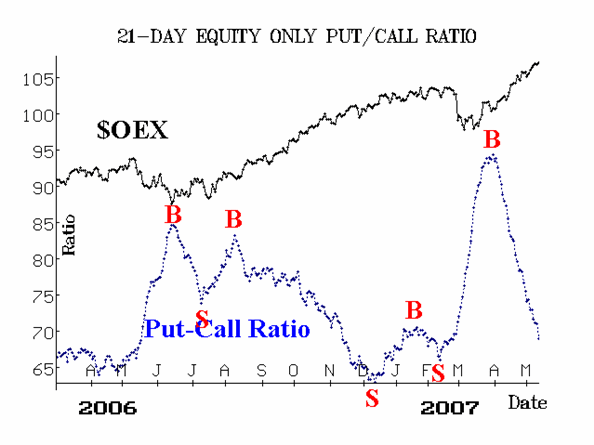
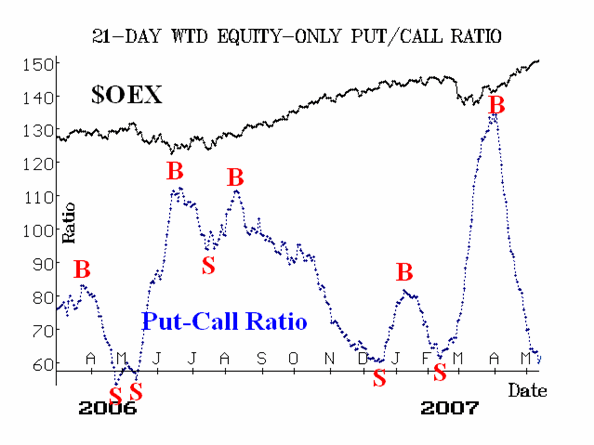
The equity-only put-call ratios continue to remain on buy signals. One day's action is not generally going to turn these 21-day moving averages around. The weighted ratio is overbought in that it is near the lower regions on its chart. However, just because the last two sell signals occurred in the same general area on the put-call chart does not mean the next one will. So, we continue to view these indicators as bullish unless they roll over and begin to trend upward.

Market breadth (advances minus declines) suffered badly on Friday, and as a result, generated sell signals. Breadth is a somewhat schizophrenic indicator though -- easily swinging back and forth between buy and sell signals -- so we tend to use it only as a confirming signal. Therefore, while the breadth sell signals are noteworthy, we are not going to change our market opinion based on them alone.

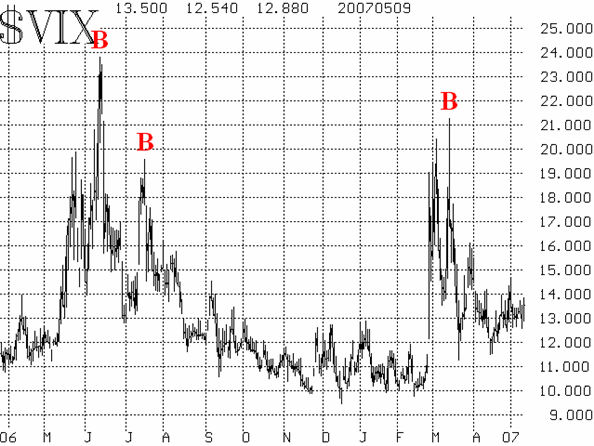
Finally, the volatility indices ($VIX and $VXO) have remain subdued, albeit at higher levels than we saw earlier in the year. $VIX moved higher on Friday, but not overly so. Specifically, $VIX was only 0.72 higher and the Dow was down 150. As a comparison, on February 27th, when the Dow was down 416, $VIX was up over 7 full points. So, option traders were not overly worried by Thursday's decline, and they -- through their opinion on $VIX -- are usually worth heeding. What would be worrisome would be if $VIX continues to rise in the coming days.

In summary, the selloff on Thursday by itself has not caused any real damage to the bullish case. So, we officially remain intermediate-term bullish. However, if some of the other indicators begin to turn bearish (especially if $SPX closes below 1475), then we will alter our view.
Lawrence G. McMillan is the author of two best selling books on options, including Options as a Strategic Investment, recognized as essential resources for any serious option trader's library.
|