| Weekly Outlook in the Stock Market |
| By Price Headley |
Published
05/13/2007
|
Stocks
|
Unrated
|
|
|
|
Weekly Outlook in the Stock Market
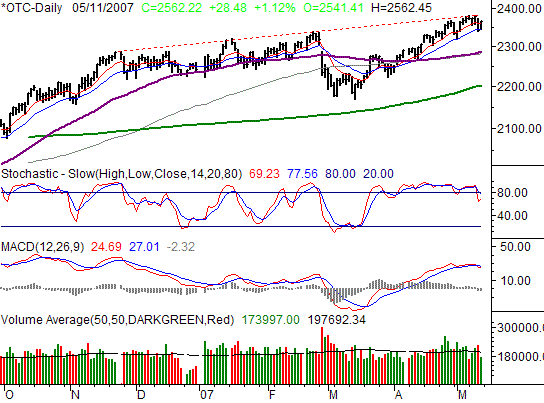
The NASDAQ Composite's 1.12% explosion on Friday pushed the index to a gain of 28.48 points. However, for the week, the close of 2562.22 was still under the previous week's close by 9.93 points (-0.39%). The NASDAQ lagging -- the only index to end the week in the red -- is something of a red flag.
We saw some significant sell signals last week, despite Friday. Both of the stochastic lines are now under the 80 "overbought" threshold - a major sell pattern. We also saw MACD cross-under. Thursday's big plunge that prompted both of those signs? It occurred on major volume. Friday's recovery effort was on much weaker volume.
Another reality is that the 20-day line (blue) was support again. This was Thursday and Friday. Considering this has been the make-or-break line for months, we can't blow that off. Plus, considering this was one of the best seven-week stretches we've ever seen, we have to cut the index a little slack. Translation: the uptrend is still technically alive, and the bears didn't do enough damage yet to change that.
By the way, the ease-off from the recent peak of 2580 occurred right as the composite bumped into an intermediate-term resistance line (red, dashed).
NASDAQ Chart

S&P 500 Commentary
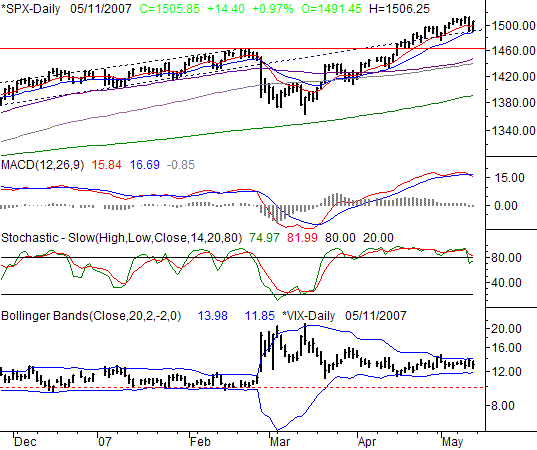
On Friday, the S&P 500 rallied 14.4 points (+0.97%) to end the session at 1505.85. For the week, that barely put the index back into the black by 0.25 points, or 0.02%. Let's call it even. But, there's a lot more going on than just a break-even.
Ditto the discussion we had about the NASDAQ. The 20-day line held up as support here, while the MACD and stochastic lines are at least halfway bearish.
The SPX also found an intermediate-term support line (dark, dashed) -- the line that was support for the latter part of last year. Did the SPX break back into that channel, and will it be able to stay there? Maybe, though we'd like to see some sort of confirmation first.
But can the S&P 500 really keep it up at this pace? It seems crazy, doesn't it? To answer the question, yes, it certainly is possible. Take a look at the VIX chart. See anything unusual? No, you really don't. That's the issue. Throughout this unprecedented rally, giddiness/complacency really hasn't gotten out of hand. In fact, the VIX is right where it was in mid-March. So, people aren't losing their minds yet. Until we get some sort of crazy, off-the-charts plunge in the VIX, that bottom might be staved off for a while. Keep an eye for a move under the lower Bollinger band (currently at 11.85) for a sign of a problem.
Are we saying the continuance of the uptrend is a given. No, not at all. We're just saying don't rule it out. As before, a close under the 20-day line will also be a bearish sign.
S&P 500 Chart

Dow Jones Industrial Average Commentary
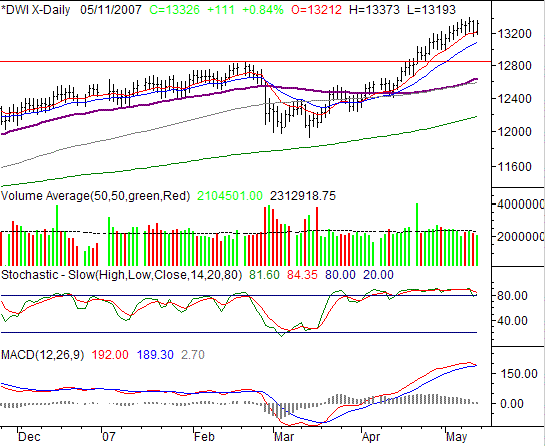
The Dow's 111 point gain on Friday (+0.84%) led to a close of 13,326 -- all-time highs again. On a weekly basis, that was enough to push the index 61 points higher than the previous Friday's close -- a gain of 0.46%.
The sell signals we discussed about the SPX and the OTC? They don't really apply to the Dow. In fact, the Dow hit a new all-time high again on Wednesday, and seems to have found support at the 10-day line (red) as well. The volume behind the Dow's steady rise hasn't been shaken, nor was volume behind Thursday's selloff really all that heavy.
Maybe the Dow's the exception, or maybe this is a sign of the overall market's true strength. Point is, the Dow's holding up pretty well so far.
On the other hand, the Dow is also ridiculously over-extended in terms of distance from the 200 day line -- 8.5% above the 200-day line (green) to be exact. And yes, that's a very unusual scenario -- perhaps too good to be true for much longer.
This coming week is expiration week, which is likely to make things more confusing rather than less confusing. Keep an eye on the VIX and the 20-day average lines - they seem most apt to tell the tale.
Dow Jones Industrial Average Chart

Price Headley is the founder and chief analyst of BigTrends.com.
|