|
Sector Spotlight on Coal and Heavy Construction
For those of you who've been reading the Sector Spotlights for more than just a few months, you may recall that our focal point of each publication used to be one primary sector, and one chart to illustrate our point. As the market changed last year -- and individual sectors started to move quite in tandem with one another -- highlighting one sector over another become a little bit moot. So, as the market environment dictated, we started to look in depth at a handful of charts each week, specifically focusing on individual industries rather than broad sectors.
Frankly, I'm surprised we're still seeing the same situation. Oh don't misunderstand. There are still leaders and laggards among the major sectors, but no one sector has been particularly bullish or bearish in months -- at least no more than any other sector.
Just for some perspective, over the last two months, energy is leading the race with a 12.9% gain, while consumer staples are lagging with only a 3.08% rise. Yeah, that's a decent difference, though over the course of two months it doesn't do much to get me jazzed. And if you look even deeper into the last two months, things get even more uninteresting. The second best performer was health care, with its 8.5% gain. The second worst performer was basic materials, with only a 3.6% gain. Again, that's a difference, but not a big enough one to really merit going to the trouble of looking for specific sector trends, especially when the differential is spaced out over a couple of months.
Why bring it up today? A couple of reasons. One of them was just to let you know what's really going on, or not going on, in this case. If you're a sector kind of trader or investor, then there's no sense in beating your head against the wall trying to find the hot one, or avoid the cold ones. It's just not happening like that, at least not right. The other reason we're putting it on the table is to let you know exactly why we're continuing to bring you what may feel like obscure charts. They're really the only charts significantly different enough to bother examining. Today's no exception.
We're sure that eventually things will change again, and the major sectors will start to diverge form one another in terms of gains or losses. But for now, the only top down approach that's likely to be of any help requires looking in the less common arenas. With that being said, on with the show.
As market technicians, we're usually inclined to look at a chart to find what we need or want to know, but we've found great success recently in looking for the absolute leaders and laggards over a particular time frame, and then looking at the underlying chart to see if the odds were decent that those trends would persist. And, over the last few months, the methodology has pin-pointed some pretty good ideas.
Fast forward to today, we're still using the methodology. Though everything below has a chart pattern we like, the reason we noticed them in the first place was that the underlying group had the biggest percentage change over the last month And no, if the bottom line results were good but the chart looked iffy, then we didn't want to waste time or space on it. Hence, not everything made the cut.
Bullish Areas
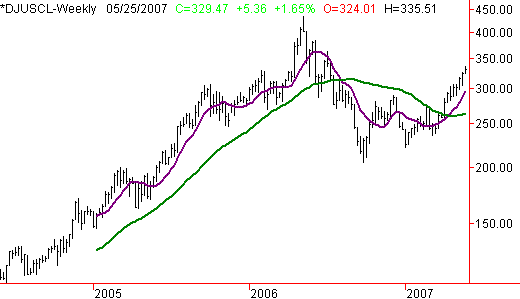
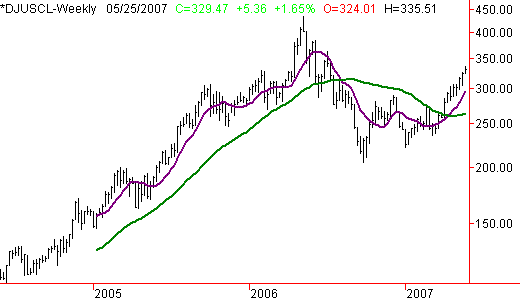
Coal: Up 6.7% in the last five days -- the second best performer for that time frame. The Dow Jones Coal Index (DJUSCL) didn't really have the best 2006, and we had our doubts about this group in 2007. However, the last six weeks have been phenomenal. Once coal gets started, it can really run -- just look back at 2004/2005.
Dow Jones Coal Index (DJUSCL) - Weekly

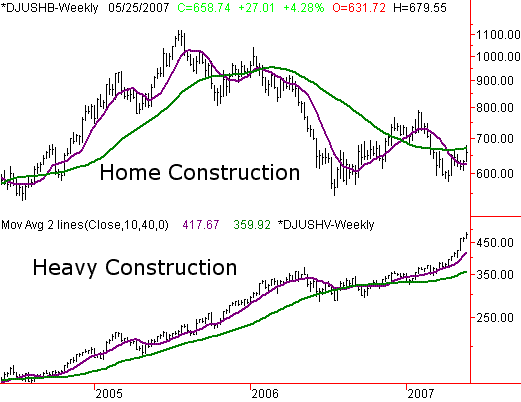
Construction: The fourth best performer over the last five days has been general home construction, while heavy construction is the one month leader, with a gain of 17.6%. Given the choice between the two, we favor heavy construction. It seems to be a little less subject to interest rate worries. The primary concern with heavy construction right now is that it looks a bit toppy. It might be easier to wait for a pullback and see if the longer-term moving averages act as support. And, the issue with home builders is clear. Had it not been for last week, they wouldn't even be on the radar.
Dow Jones Home Builders & Heavy Construction Indices - Weekly

Bearish Areas
Real estate (and REITs, to be specific): Real estate and REITs somehow managed to lose about 1.5% each. The Dow Jones Real Estate Holdings/Development Index (USRH) is actually finding support at the 50-day average line, but has still given ground after hitting a ceiling around 515 for the second time in a few months. It may be challenged here by being at the top of a generally bullish trading zone, framed in red. The Dow Jones REIT Index (USRI) has a clear problem. It fell under its 200-day line two weeks ago, not to mention a long-term support line.
Dow Jones Real Estate & REIT Indices - Weekly

Though we still aim to get back to our one chart/once sector focus when it makes sense to do so, we may also incorporate an'absolute change study into future Sector Spotlights...as long as its relevant. We've found this added layer of detail has been very beneficial.
Price Headley is the founder and chief analyst of BigTrends.com.
|