|
Weekly Outlook in the Stock Market
NASDAQ Composite
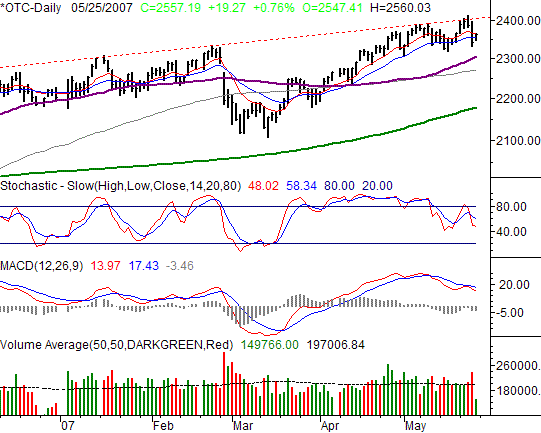
The NASDAQ Composite’s 0.76% gain on Friday (+19.27 points) led to a close of 2557.19 on Friday. For the week, however, it still wasn’t enough to close the gap. The index ended Friday 1.26 points under the prior week’s close, or -0.05%.
Our take on the last week? We have to take things literally. With that in mind, we have to start thinking bearishly here. There are several reasons.
One of them is the long-term resistance line (red, dashed) we pointed out a couple of weeks ago. It actually did act as a ceiling in early May, when it was touched at 2580. The bulls eased up a bit, and then took another swing last week – and that one failed too. The result was a disastrous Wednesday’ and Thursday. As of Friday, the OTC still closed under the 10-day line, though not the 20-day line. Another close under the 20-day line would act as a confirmation of this bearish sign.
Signal number two: the stochastic crossunder. We actually got one in early May, and it was renewed on Wednesday. Remember, for us, the stochastic sell signal is when both the %K and %D lines fall under the 80 overbought threshold, AND a lower close under on the same day.
Momentum? Yep – that’s bearish too. We got a bearish MACD cross several days ago, and we’ve seen a new bearish divergence since then.
And let’s not forget volume; it’s bearish too. Wednesday and Thursday were distribution days, and Friday’s buy-in was on the lowest volume we’ve seen in weeks...not exactly a ‘majority’ opinion. There were far more votes cast on Wednesday and Thursday.
So, the pieces are in place. All we really need to see next is a close under the 20-day average (blue) at 2550. Preferably, we’d like to see a close under Thursday’s low of 2531.38. That, however, is simply a ‘what if’. A cross back above the 10-day line (red) at 2558.48 may spark another uptrend, up to that resistance line anyway.
Just for the sake of continuity, we’re going to go ahead and look at the S&P 500 and the Dow Industrials as well. However, we’ll warn you – the same discussions we had for the NASDAQ pretty much apply below.
NASDAQ Composite – Daily

S&P 500
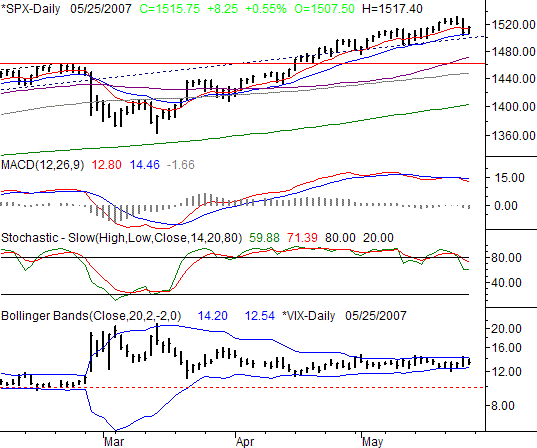
The S&P 500 managed to make a rebound of 8.25 points on Friday (+0.55%), closing out at 1515.75. For the week, the SPX still lost 7 points though, or -0.46%. It was the first loss the index had seen in the last eight.
MACD and Stochastic sell signals? Yep, got ‘em both here. There is one key difference with this chart though the 10- and 20-day lines. The 20-day average (blue) acted as support Thursday and Friday, ending the selling on the first day, and acting a s a springboard for the second. It’s currently at 1505.66, and that will serve as the primary sell signal for the S&P 500. We haven’t been under it since late March, though it’s been tested a handful of times.
Even past that, there’s the long-term support line (dark, dashed) that could step in and play a role at 1499. So, we’re not quite as pessimistic here, at least not for the time being.
On the flipside, the S&P 500 closed above the 10-day average (red), currently at 1514.05. So, in a technical sense, the trend is still bullish.
Side note: Check out the VIX. It's flat as a pancake (despite a few attempts to push it outside of those ever-tightening Bollinger bands). As we’ve been saying, this is a slow build for a bigger move with periods of low volatility are followed by periods of high volatility. We continue to monitor this chart, waiting for a break above 14.70 or under 11.50. Which direction might that be? As we’ve said a few times, we’re now into the weakest period of the year, and way overbought to begin with. Plus, the chinks in the armor became evident this past week. It’s a reasonable argument.
S&P 500 - Daily

Dow Jones Industrial Average
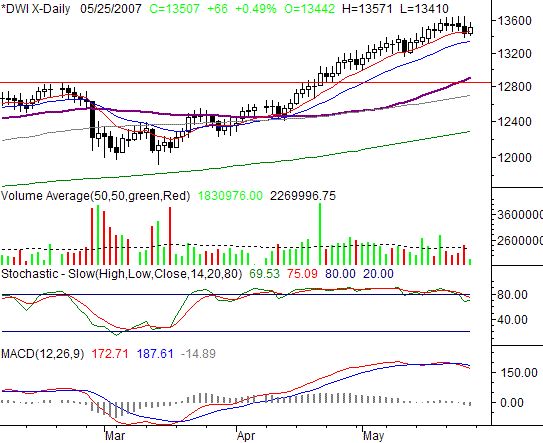
On Friday, the Dow Jones Industrial Averages added 66 points to its tally (+0.49%), ending the week at 13,507. It was the first time in six weeks the weekly close wasn’t a new record. And speaking of weeks, on a weekly basis, the Dow’s rise on Friday still wasn’t enough to push it back into the black – it closed 50 points below the previous Friday’s close -- a loss of 0.37%.
Everything said above? Ditto for the Dow. The key here, like the SPX, is in the 10- and 20-day lines. The 10-day line (red) at 13,460 seems to be keeping the index held up, and the 20-day line (blue) hasn’t even been tested yet. It’s at 13,341. A close under that line would be a confirming sell signal.
Dow Jones Industrial Average – Daily

Price Headley is the founder and chief analyst of BigTrends.com.
|