|
A Little Discretionary Spending, Please
Are we on a slippery slope of a recession, or was last quarter's weak GDP a turning point? This week's travel shortened column looks at recent data and re-visits some thoughts on consumer spending from friend Joe Ellis' superb book called Ahead of the Curve. This week I wrote from a rainy Edinburgh, Scotland, although this afternoon was pleasant enough, allowing me to walk around some. But on to important matters.
Yesterday we learned that GDP for the first quarter was revised down from 1.3% to 0.6%. By anybody's definition that is an economic slowdown. The question is then begged, "Was last quarter the bottom or the beginning of the slide?"
You can make a good case that it was the bottom. A good part of the weakness was attributable to the lowering of inventories. Therefore, as inventories are re-built, then there should be a rebound. Further, today's new jobs number of 157,000 is a lot stronger than April's anemic (and revised downward) number of 80,000. And let's not forget that the ISM number came in at 55, which suggests manufacturing is beginning to rebound. If you are looking to be optimistic, there is sufficient data to maintain your beliefs.
Of course, it would be better if you did not look too closely at the jobs and other data. Specifically, the BLS added 203,000 jobs in its "birth/death" model, or 46,000 more jobs than the headline number. The birth/death model creates jobs that do not show up in the establishment survey from employers that are too new to show up in anyone's database.
Another way of estimating employment is the household survey, where they actually call a statistically valid number of homes and ask how many people are working in the household? That survey shows a much weaker 66,000 new jobs. Why the discrepancy?
In rising cycles, the establishment survey tends to understate job growth relative to the household survey at growth turning points and you get very large upward revisions to the establishment survey after a year or so.
The opposite is true during periods where the economy is slowing. The establishment survey tends to overstate employment. Remember, the birth/death model is a backward looking guesstimate. And you really do have to have such a statistic in the establishment data to account for the actual production of jobs. But we need to take these numbers with a large dose of salt if you think we are at a turning point. As the last chart we look at in this letter suggests, we may indeed be at one.
And the key is consumer spending. Personal income fell 0.1% in April, with wages and salaries down a larger 0.4%. Real disposable income also fell 0.4%. This leaves it up just 0.4% annualized over the past three months, which is not supportive of significant increases in consumer spending. As we noted last weak, retail sales and discretionary spending is down.
Some Discretion in Discretionary Spending, Please
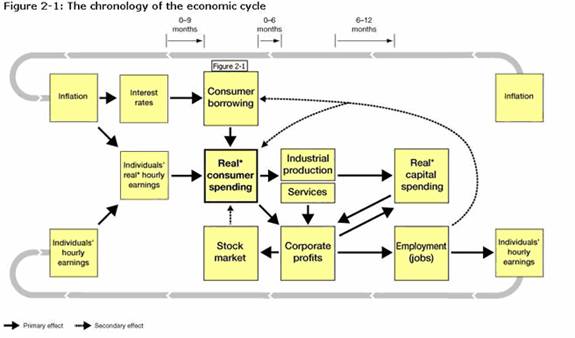
But before we go into too much detail, let's turn to Ahead of the Curve. I highly recommend the book, and you can get it a www.amazon.com. I am going to include two charts. I hope they come through, but if not you can go to www.aheadofthecurve-thebook.com and click on them and a lot more. The first chart is a drawing of how Joe sees the business at work. It is figure 2.1 on the web site:

Let's let Joe give us his explanation of the chart:
* Personal income - largely wages and salaries - is the primary driver of consumer spending, by far the largest sector in the economy. Credit and borrowing play a role, but if we can identify the most important indicators of spending power through wages, we have a shot at forecasting consumer spending. [Important: remember the data we quoted above - wages and salaries are down in April and under pressure.]
* Uptrends and downtrends in consumer spending drive advances and declines in manufacturing and services.
* In turn, the capital spending sector of the economy, which includes companies' spending on plants and equipment, follows, like clockwork, the trend set by production and services, and consumer spending before them.
* These three sectors of economic activity - consumer spending, industrial production and services, and capital spending - represent the core of corporate profits produced in the United States, so the dependence of corporate profits on consumer spending is also clear.
* The stock market, which advances and declines as a sensitive predictive mechanism reflecting corporate profits, is therefore also tied closely to consumer spending at the front end of the cycle. This makes it easier to understand the sequencing of the stock market in this chain of cyclical events, with major stock market advances and declines tending to occur at similar points in successive cycles.
* Because business hire or fire workers based on the respective rise or fall of sales and profits, employment - jobs - follows rather than leads the economy. Mastering this fact is one of the core hurdles in overcoming emotional but erroneous reactions to economic news.
"In other words, consumer spending is dominant in the economy as a whole to such an extent that it is, by itself, the sector that cyclically determines the direction of the overall economy. This being the case, carefully monitoring overall consumer spending - or, even more significantly, forecasting the direction of consumer demand - is the key that unlocks effective forecasting for most other developments and sectors in the economy."
Real Consumer Spending Is the Key
Real consumer spending is at the heart of the process. As the following chart will show, and we will look at in-depth next week, a slowing of real consumer spending will precede a recession. It will usually trigger a stock market sell-off. If we can see what drives real (by that we mean after inflation) consumer spending, then we can get a real heads up on the cycle.
Individual hourly earnings obviously influence the amount that people can spend. Inflation determines how much "real" spending they can do. If your salary goes up 2% and food goes up 2%, then you are spending the same "real" amount on food. Real consumer spending is a combination of real hourly earnings plus what they can borrow. That in turn drive corporate profits, industrial production and services, which drives both employments and the stock market.
By the time employment starts to turn down, the stock market is typically already in a swoon. By the way, employment confidence is a big factor in consumer borrowing. In 1999, real hourly wages turned down but the recession and bear market was held off for over a year because of the wealth effect (and subsequent borrowing) from the stock market.
And I suspect that we are seeing much of the same phenomena today, except that the wealth effect is from housing and mortgage equity withdrawal, which is clearly coming down. And as MEW is dropping and energy costs rising, we see that consumer spending is dropping as well.
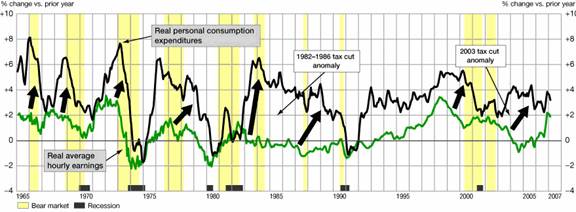
So, what is the data saying? Let's look at Figure 10-7 (from his chapter 10):
Real hourly earnings: Best leading indicator of real consumer spending (PCE) downturns:

"Real hourly earnings downtrends of a year or longer have been a generally reliable leading indicator of consumer-spending downtrends. Real hourly earnings gave particularly notable advance warning of the 2000-2002 economic downturn.
"Real hourly earnings are reported on a pretax basis. Therefore, in the mid-1980s and 2003-early 2004, strong gains in consumer spending despite slowing real earnings were an anomaly reflecting federal tax cuts in those periods."
Joe's comments on this chart: "Individuals' year-over-year real average hourly earnings comparisons have rebounded to flat from the actual declines in late 2004 and 2005. However, the cumulative declines in purchasing power of the past five years have not yet affected consumer spending nearly to the degree that would have been expected (particularly once the year-over-year effect of the 2003 tax cut had elapsed). The answer seems clear: consumer borrowing, particularly on homes, has continued at such high levels that the American savings rate has been negative for over a year now. This would seem to be unsustainable, indicating some further weakening in the growth of real consumer spending over the coming year."
Notice that when Clinton increased taxes in the 1990s, real hourly earnings were rising at a very healthy clip, offsetting the increased taxes. I think it is likely a tax increase today would have the opposite effect, as real hourly earnings are low and dropping.
A significant part of consumer spending is made up of borrowing and the spending of savings. If housing prices start to stall, we will see an even bigger drop in borrowing.
Without borrowing and with rising energy prices, with increased borrowing costs for those with adjustable rate mortgages, with increased credit card costs, higher local taxes, there is very little discretion left in discretionary spending.
The market shrugged off the weak GDP numbers. Evidently, the thought that interest rate cuts may soon be in the offing is a heady drug. Profit increases seem to be coming in lower than last year, even as revenues are being guided lower in a significant number of firms. But that is not affecting the stock markets yet. Higher interest rates and energy costs will squeeze corporations as well. But as Joe noted, consumer spending is a key driver to US corporate profits.
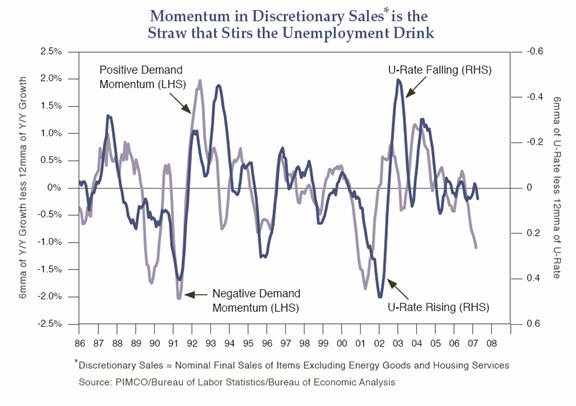
And finally, let's turn to a chart I used last week from Paul McCulley's recent essay at www.pimco.com. Quoting Paul: "First and foremost, unemployment is a lagging variable, notably of momentum in discretionary aggregate demand. And discretionary aggregate demand has been unambiguously decelerating in recent quarters, and not just in residential construction, as displayed in the chart below."

And to re-enforce a point I made earlier about the unemployment numbers, let's review this point made by Paul:
The Great Puzzle
"So why hasn't the unemployment rate already risen? It's the great puzzle, in the words of San Francisco Fed President Janet Yellen.
"The short answer to the puzzle is that the labor force participation rate has fallen, accounting fully for the drop from 4.7% to 4.5% for the unemployment rate over the last year. But this doesn't make sense when you look at nonfarm payroll [establishment survery] growth, which, again in the words of Ms. Yellen, has been gangbusters. The labor force participation rate is decidedly pro-cyclical, meaning that it goes up as tight labor markets induce new entrants into the labor market; and it goes down when soggy labor markets lead the discouraged unemployed to drop out of the labor force. So, the short answer to the puzzle is the right answer only if nonfarm payroll growth really ain't gangbusters.
"And new research by both Ray Stone of Stone and McCarthy and Sheryl King of Merrill Lynch suggest this is indeed the case. Please refer directly to their research for the exhaustive details, but the bottom line is simple. Detailed data in the Bureau of Labor Statistics (BLS) Business Employment Dynamics (BED) release, which comes out with a two-quarter lag, show employment growth of only 19 thousand in 2006Q3, while the nonfarm payroll tally for that quarter was over 450 thousand. More recently, the BLS's more timely Job Opening and Labor Turnover Survey (JOLTS) for April - last month! - showed job openings rose only 24 thousand, with this series essentially flat since last August. The JOLTS report also showed that new hires in March (this data subset is released with a one month lag) fell 29 thousand.
"Something smells more than fishy here. Not that I'm accusing the BLS of any skullduggery. None! Rather, it is a historical fact that nonfarm payrolls - before annual benchmark revisions, which continue for six years! - understate employment early in recoveries (leading to the inevitable contemporaneous label of 'jobless recovery'), while they overstate employment late in expansions."
For all the reasons noted above, there is good reason to think the economy may be softer than most analysts and economists think. There is no reason to believe that we are in for a major recession, but the serious slowdown or mild recession I called for last year is more than a distant possibility. We are in (or at least were in) a serious slowdown. It remains to be seen if we actually slip into recession. Stay tuned.
John Mauldin is president of Millennium Wave Advisors, LLC, a registered investment advisor. Contact John at John@FrontlineThoughts.com.
Disclaimer
John Mauldin is president of Millennium Wave Advisors, LLC, a registered investment advisor. All material presented herein is believed to be reliable but we cannot attest to its accuracy. Investment recommendations may change and readers are urged to check with their investment counselors before making any investment decisions.
|