|
Weekly Outlook in the Stock Market
NASDAQ Composite
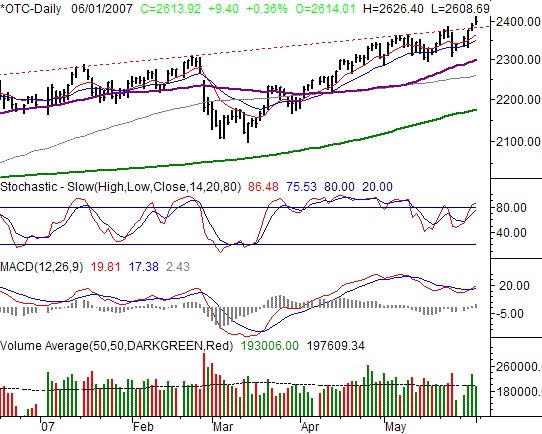
The NASDAQ Composite’s close of 2613.92 on Friday was 0.36% better than Thursday’s – the result of a 9.4 point rally. That close was 2.22% better than the previous Friday’s close, thanks to the 56.73 points gained in just four trading days this past week.
The overall momentum is bullish, as indicated by a MACD cross, and a break past a long-term resistance line (red, dashed). On the other hand, the market has not been receptive to even the slightest bit of over-extension this year, reeling the composite whenever its gets about 40 points beyond its 10-day average line (red).
This tendency, coupled with the noticeable retreat from most of Friday’s intraday gains, doesn’t exactly say the index is ready to take flight. Rather, it suggests the NASDAQ is likely to get reeled in again. On the other hand, those brief retreats have typically been nothing more than revisits of the 20-day line (blue). So, the dip is most likely nothing more than a buying opportunity. Only a break under the 50-day line for the NASDAQ would really put us on the other side of the fence.
So, whether we’re bullish or bearish really depends on your timeframe. And, it’s worth remembering that the NASDAQ’s analysis is a bit different than the SPX’s or the Dow’s. Keep reading.
NASDAQ Composite Chart - Daily

S&P 500
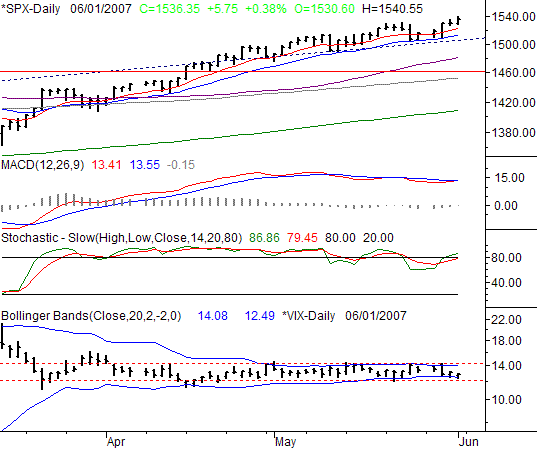
The S&P 500 managed to close 5.75 points higher on Friday, gaining 0.38% on its way to 1536.35, another new high close. For the week, the index gained 20.6 points, or 1.36%. The bulls never really looked back, going full steam ahead in the shortened week.
Despite the odds, the SPX managed to make good on the recovery effort started late last week. And why not? Six of the previous eight weeks were bullish – now the record stands at seven of the past nine.
The potential drag on stocks remains the sheer weight of being overbought. We’re on the verge of seeing both stochastic lines back above the 80 ‘overbought’ threshold…again.
The thing is, nobody seems to care if we’re overbought. As long as the market can ignore the danger, they’re apt to keep on buying. As such, our outlook remains sided with the trend – bullish until it’s clear we shouldn’t be.
And what will signal the end of the trend? If there’s one thing we saw confirmed last week, it was to watch the 20-day line (blue). It halted the decline from two weeks ago, and served as the springboard for Wednesday’s reversal, as well as the follow through for the rest of the week. We may get a stochastic sell signal in the meantime, but unless the 20-day line breaks down, we’re not going to be anything except bullish despite the odds.
That being said, we actually got a new MACD crossover on Friday. So, the bullish arguments are just as valid as any bearish view.
Note, however, that the SPX hasn’t been explosively bullish all year long. If you’re thinking about being a buyer, we suspect you’ll get a chance to get in on a pullback. So, don’t feel like you have to chase this thing. In fact, the wise move may be to wait and see if the 10- and/or 20-day lines do indeed maintain their support. If so, that may be a lower-risk entry point.
In the meantime, the VIX remains stuck between 12.40 and 14.40. This may well be a better tool to use than any other in terms of spotting the next reversal point. As long as it’s steady (i.e. flat), the market may well be able to grind out moderate gains without getting to the point of over-heating. That low volatility has been the key to the rally’s longevity. When the VIX breaks out of that channel, then the tide may be turning.
S&P 500 Chart - Daily

Dow Jones Industrial Average
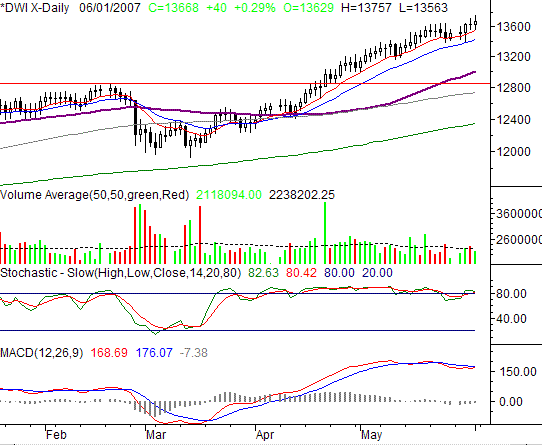
On Friday, the Dow Jones Industrials gained 0.29%, or 40 points, to end the week at 13,668. That left the blue chips 161 points above the prior week’s closing level, up 1.19%.
Ditto to what we said above -- mostly. The 10- and 20-day lines have been decisive support here, so we continue to monitor them closely on this chart. In fact, the precision with which the 10 day line has been support is uncanny. The 20 day line (blue), however, is going to be the make-or-break point. On Wednesday, it was clearly a ‘make’ point, spurring a recovery.
Just an FYI, the Dow is now 10.7% above its 200-day line (green). As we’ve said off and on for weeks, that’s well past the normal tolerances for this chart, and lends itself to a bearish argument. But so far, it’s only been a point of discussion – not a reality. Once we start to breakdown it could be big, but that could be a while.
One thing to watch for here: volume. The summer time could become pretty lethargic, but the clues provided by volume trends are still fully valid even if momentum tools are not. Though the Dow is up for the past few weeks, the buying volume has been well under the norm. During that same period though, the few selling days we had were at least all on pretty strong volume. Since the volume tide tends to turn first, it’s critical to keep any eye on it. That said, it’s not particularly telling as of right now
Dow Jones Industrial Average Chart - Daily

Price Headley is the founder and chief analyst of BigTrends.com.
|