| Catching Up with Stock Sector Action |
| By Price Headley |
Published
06/6/2007
|
Stocks
|
Unrated
|
|
|
|
Catching Up with Stock Sector Action
Over the last few weeks, we've been so busy looking for new and likely obscure trends, we haven't had a chance to bring you many updates on prior sector trends we've discussed. That changes today, however. Let's revisit some of our more recent observations, and update them where we need to.
Utilities
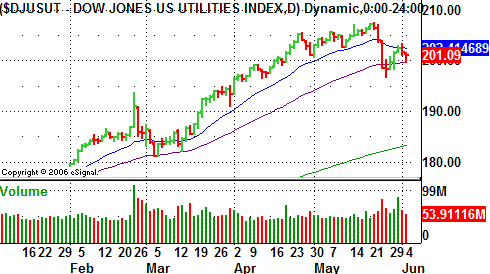
If this group rings a ball with you, it's probably because we looked at them just last week. However, we also looked at them back on March 26th. Back in late March, the Dow Jones Utility Index (UTIL) had been going like gang-busters. Nice momentum, as long as it persists, but like we said then, the higher they fly, the farther they fall. These stocks continued their heroic run through April and even part of May, but as we worried, the ball of yarn is starting to unravel.
We pointed out last week that the retest of the 50-day line as support was critical. As of then the test had been passed. In fact, the index seemed to push off of it briefly last week. But, the 20-day line quickly capped the rally, and has since sent the utility index back down to its 50-day line. This quick reversal lends itself to the generally bearish concern, thus as before, only a close or two under the 50-day line at 515 would really complete this bearish pattern.
Dow Jones Utility Average (UTIL) - Daily

Toys
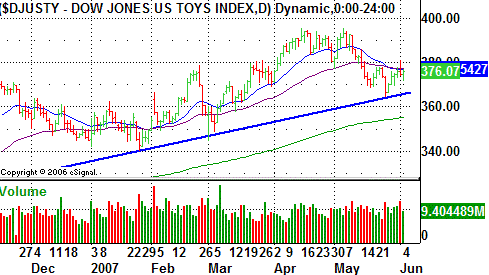
On April 2, we mentioned that the Dow Jones Toy Index (DJUSTY) looked like it might be ready for another bullish leg. At the time the index was at 374, and did indeed make a nice move up to around 395. Since then though, the rally has tapered off, and the index has fallen back under its 50- and 20-day lines. Being essentially back to where we were - with the index currently at 376 - that call may be in a questionable position. However, we've noticed this dip was reversed when an intermediate-term support line was reached. A cross back above the 20/50 day line at 377 could reignite the upside potential, though we don't necessarily expect another big run -- 40 points would be a lot of ground to cover in the current situation.
Dow Jones Toy Index (DJUSTY) - Daily

Biotech
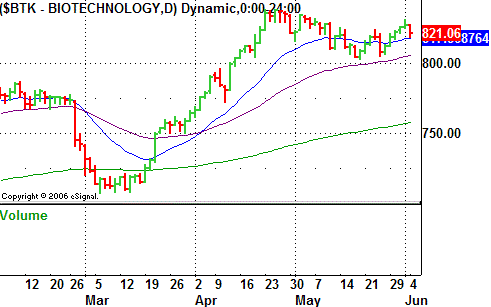
Our April 2, bullish biotech call was spot on. The AMEX Biotech Index (BTK) ran from 765 all the way up to 837 - a 9.4% move. But, since then we've seen this chart pull back a couple of different times, currently at 821. With buyers now relatively scarce, let's go ahead and cancel that bullish opinion, and gladly take a little profit from a swing nobody else really expected.
AMEX Biotech Index (BTK) - Daily

REITs
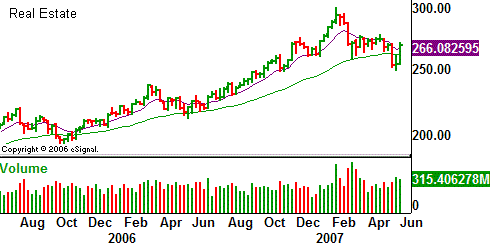
On May 1, we turned bearish on the Dow Jones REIT Index (RCI), as it had made a sharp peak in early February, and then started to freefall. The litmus test was going to be the 200-day line and/or the 'neckline' of a potential head-and-shoulders pattern - both around 260. Well, both were indeed breached, but only temporarily. The index rebounded just as sharply and is now back above all of its key long-term lines as well as short-term averages, and back above the area where it was when we first went bearish. Based on the reversal and further potential recovery efforts, we're canceling this bearish view as well - these stocks just have too much ability to fall into favor overnight, meaning other investors may be thinking nothing but 'buy on the dip' here. If this bounce gets traction, we may even opt to get bullish again -- the last revisit to the 200-day line was a major entry opportunity.
Dow Jones REIT Index (RCI) - Weekly

Price Headley is the founder and chief analyst of BigTrends.com.
|