| The McMillan Options Strategist Weekly |
| By Lawrence G. McMillan |
Published
06/8/2007
|
Options
|
Unrated
|
|
|
|
The McMillan Options Strategist Weekly
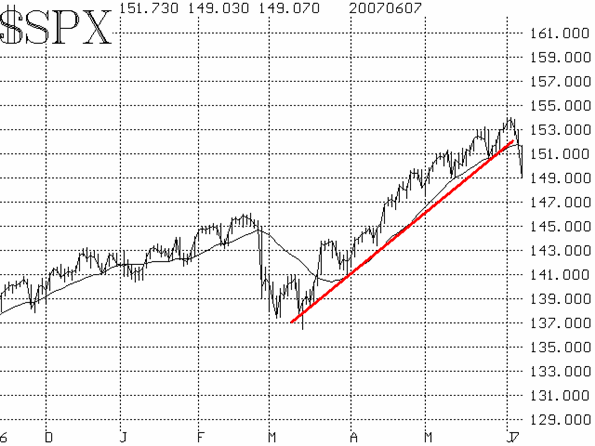
The bulls were undone by a sharp rise in interest rates. While it is true that rates have been rising for some time (look at a chart of T-Bonds, for example), the fact that they rose above 5% was a damaging psychological level. There is no real reason why 5% should be a catalyst, except that it is a round number. In any case, this appears to be more than just a sharp, short-lived correction in a bull market. The technical indicators have degraded to the point where they are uniformly bearish, and the breakdown in $SPX has confirmed a change of trend.
$SPX broke down below support -- which this week had been the 1510-1520 area. As is often the case, the support wasn't broken by a small amount; it was smashed to smithereens. As a result, the market may be oversold, but the die has been cast. The uptrend is broken, and the 1515-1520 area represents resistance (although we doubt that $SPX can rally back to there quickly). As is often the case, once the crowd decides that it wants to sell, everyone tries to squeeze out the exit at once -- resulting in a day like Thursday. The lows were near 1490, where the market rebounded from in early May. However, the setup of the technical indicators is much more negative now, so we wouldn't expect more than token support from the 1490 level at this time.

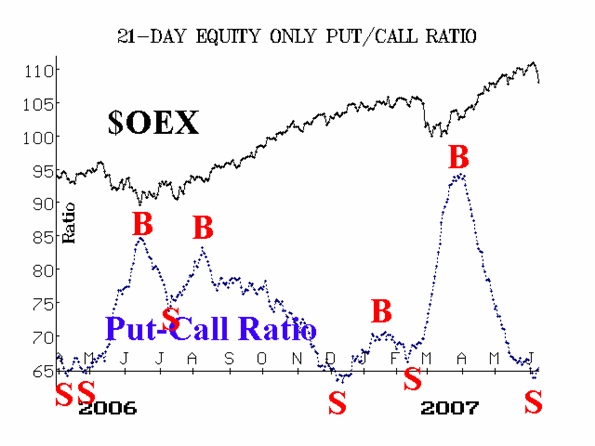
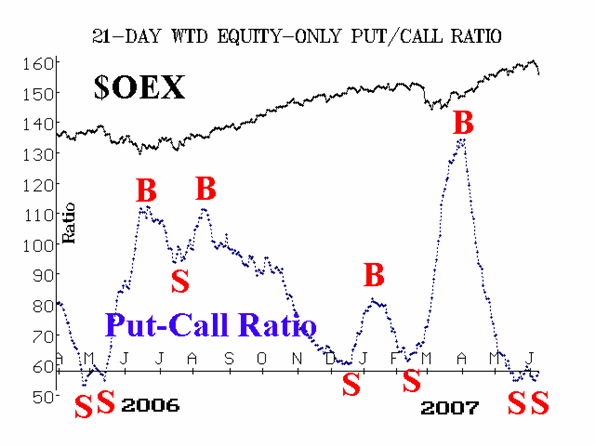
The equity-only put-call ratios had been toying with sell signals for over a week. As of Wednesday's close, the weighted ratio had returned to a sell signal, and the standard ratio was extremely close to generating one of its own. Now there is no doubt. Thursday's move confirmed that both are now on sell signals. Since these are intermediate-term indicators, we expect that this decline will be longer-lasting than the minor corrections that have been seen in the last 12 months. Moreover, since these sell signals come from the lower regions of the put-call charts, they are expected to be reliable.

Market breadth had deteriorated earlier this week. The actual market highs were made on Monday, June 4. Breadth began to deteriorate after that, and gave sell signals as of Wednesday's close.

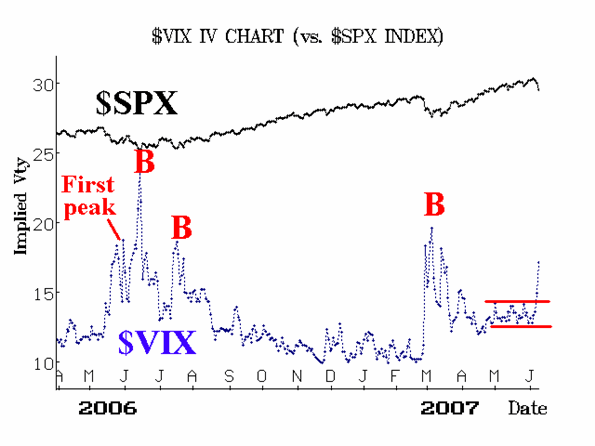
Finally, volatility indices ($VIX and $VXO) have spurted upward. $VIX broke out of a two-month long trading range on Wednesday, and $VXO was rising as well. Now, both are in uptrends. Eventually, there will be a market rally when these indices peak, but we expect it to be more like the pattern of a year ago (see Figure 4), where the first peak in $VIX was not the final bottom for the market.

Usually, a top is formed in a rounding manner. That is, the market flattens out and takes some time to roll over and head south. That didn't really happen this time -- mostly because so many longs were sitting on hair-trigger sell orders, which flooded into the market at the first sign of danger. We now expect that the market will decline for several weeks, if not longer.
Lawrence G. McMillan is the author of two best selling books on options, including Options as a Strategic Investment, recognized as essential resources for any serious option trader's library.
|