| Have We Hit a Bottom in the Stock Market? |
| By Price Headley |
Published
06/8/2007
|
Stocks
|
Unrated
|
|
|
|
Have We Hit a Bottom in the Stock Market?
Wasn't Thursday pretty much all the convincing we needed to get bearish? No, not really. It was awful, no doubt about it. And we're deep in the hole for the week. However, February's and March's steep losses only took five days to start before a bottom was hit. And, the indices are really just back at some key support levels. With nothing fundamentally different about the economy than what we already knew a week ago, we're not throwing out the idea of a rebound. We've seen it before.
That being said, do keep in mind that our analysis probably raises more questions, without answering many (if any) at all. Those answers are likely come on Friday, or more completely by early next week, when some of these issues start to reveal their true nature.
We've looked at tit before, but it's getting noteworthy again. What we're talking about is the number of advancers versus the number of decliners, the number of new high and new lows, and the amount of advancing volume versus declining volume. A heavy does of ay of them can mean a trend is in place. An explosive surge in any of them may signal the end of the trend, and the beginning of a reversal.
First up, the NYSE's new highs and new lows. We unofficially had 61 new NYSE lows, and only 51 new highs. That's the biggest bearish disparity we've seen since March 14. The thing is, March 14 was the bottom, and the beginning of a monster-sized uptrend. So, in some regards, we may have just seen a short-term implication.
S&P 500 with new NYSE high/new NYSE lows - February through June
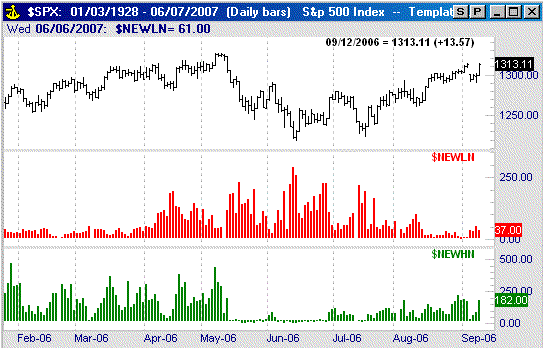
The bearish counter-argument is what we saw in this middle of last year (yeah, maybe not coincidentally around this time last year). The ultimate June 13 bottom was made when there were 12 new high, and new lows were 291.
S&P 500 with new NYSE high/new NYSE lows - Feb 2006 through Sep. 2006
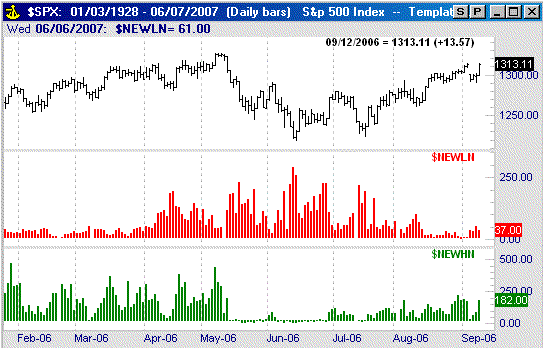
So, the question is (as always), was Thursday enough to really flush out all the sellers, or is this just the tip of the iceberg? We're more inclined to think the latter - that we need to see the new high/low dynamic get strangely out of whack before making a true bottom (though that's a far cry from making a firm call).
We're also fans of comparing up volume and down volume. Again, when either or both are nominal, a trend is in place. It's when things widely deviate from normal readings that we think reversals could be in store.
On Thursday, the NYSE's up volume was 103 million shares. The down volume was 1.79 billion shares. That's a ridiculous disparity - and again has the potential to be a signal of a bottom, like we saw on March 13.
S&P 500 with NYSE up and down volume - February through June
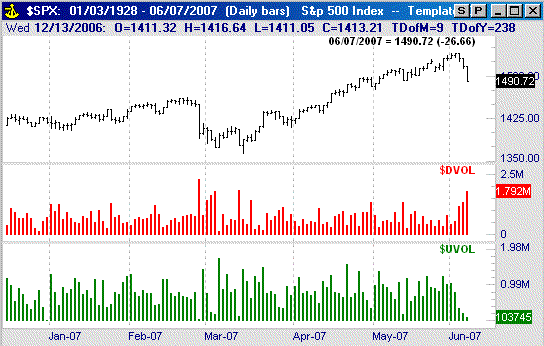
But how does this up and down volume compare to what we saw last spring? Actually, this was basically how bad it was when things were at their worst. The numerical levels are basically the same then as they are now (though they stayed at those levels for a while). While there are always exceptions, the current volume picture probably can't get much worse, meaning this chart really does have bottom implications somewhere in its near future -- a lot more than the new high/low chart does anyway.
S&P 500 with NYSE up and down volume - Feb 2006 through Sep 2006

Last up, the number of advancers against the number of decliners. There are a total of 3,373 NYSE-listed stocks. Except for the few that didn't change price on Thursday, they either went up or down. As it turns out, 3,013 fell back, while only 274 moved ahead.
S&P 500 with NYSE advancer/decliners - February through June
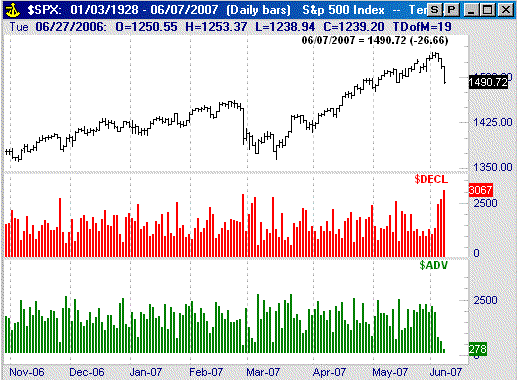
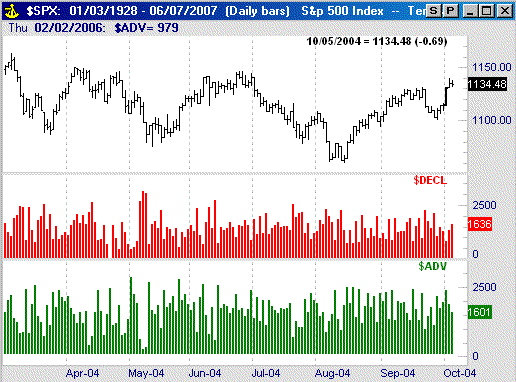
So what does that mean for the market? Believe it or not, that was the biggest number of decliners we've seen since the bottom we saw in May of 2004. It was also the lowest number of advancers we've seen since then. Given that instance was a bottom leads us to believe Thursday may have also been one. Take a look at the 2004 chart.
S&P 500 with NYSE advancer/decliners - March 2004 through Oct 2004
There is one fundamental pitfall with calling a bottom at current levels: We're only three days into a downtrend. Prior bottoms indicated by the data we looked at above were made after a few weeks worth of weakness got us to those outrageously skewed breadth and depth readings. To get to those same levels this time around in only three days is a major red flag, putting them all into question. That's why we're not making a call now...we're just letting you know the scoop. Like we said, tomorrow and early next week are critical.
Stay tuned. We'll update these charts when merited. By the way, I think the next big hurdle for the bears to get past is the 50-day average line.
Price Headley is the founder and chief analyst of BigTrends.com.
|