| Weekly Outlook in the Stock Market |
| By Price Headley |
Published
06/10/2007
|
Stocks
|
Unrated
|
|
|
|
Weekly Outlook in the Stock Market
NASDAQ Composite Commentary
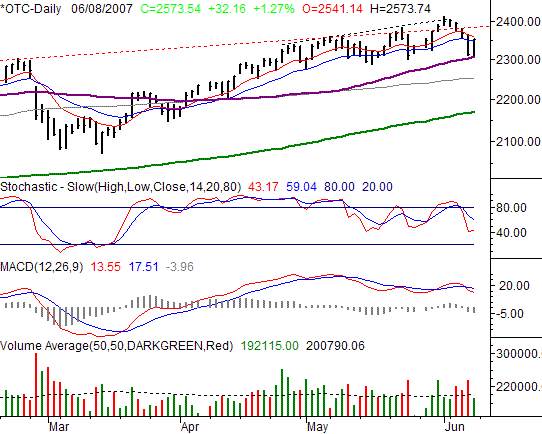
Friday's close of 2573.54 was 32.16 points higher than Thursday's close for the NASDAQ Composite, a 1.27% gain. Not bad, but don't get too excited yet. For the week, things were still ugly. The NASDAQ closed 1.54% lower than the composites' close a week earlier, losing 40.38 points in the five past days.
We're not going to dwell too much on the NASDAQ's details here, as the key themes here are pretty much the same ones seen on the other two charts...the market is trapped somewhere between the 20- and 50-day lines, and whichever one of those breaks first is probably going to signal the next major move.
In the meantime, we'll add this. The NASDAQ had trouble at a key resistance line -- two of them actually (dashed). More and more we're seeing the NASDAQ lag or struggle, which is not exactly a sign of aggressive investing. The volume behind those strong days has also paled relative to the kind of volume we've seen behind the selloffs.
NASDAQ Composite Chart

S&P 500 Commentary
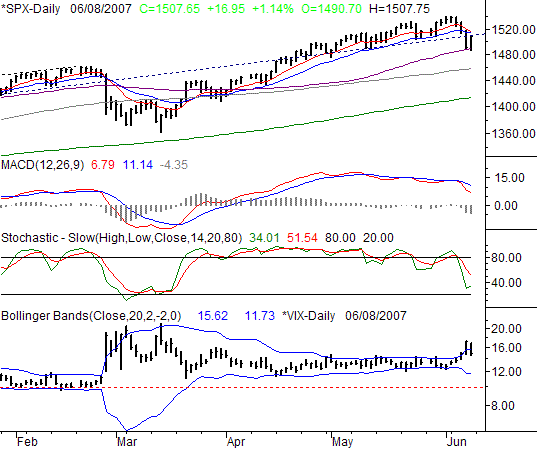
After gaining 16.95 points (+1.14%) on Friday, the S&P 500 ended the week at 1507.65. On a weekly basis, the large caps still collectively lost 1.87%, the SPX lost 28.7 points. So, don't assume all is necessarily well again.
A philosophical observation: you can only burn a candle at both ends for half as long. The S&P 500's March-through-May rise was red hot, but really pushed the limits of just how far and how fast it could go. Traders paid the price last week, cooling off the rally and bringing some reality back into the picture.
What's next? You know, as due as we still are for a correction, you really cold make an argument that a bounce is in the works. How so? Take a look at the 50-day moving average line (purple) at 1490. The pullback was stopped dead-cold there on Thursday, and it was basically the staging ground for Friday's rally. And, you don't need us to tell you the longer-term trend has been a bullish one.
And, with the VIX's floor (lower Bollinger band) being moved to 11.7 and the VIX making a sharp reversal, it's not like there's an immediate cap there either. The VIX's close at 14.84 on Friday means there's still about three points worth of downside room to fall while stocks can continue to rise.
The counter-argument is everything else.
In terms of momentum, based on MACD lines, the scenario is bearish (the lines are pointed lower). In terms of correcting the stochastic overbought situation, that problem is being solved too by a pullback. And, let's not forget the calendar. The "sell in May" thing is behind schedule, but that just might mean it's poised to make up for lost time.
We see the key as being the 10- and 20-day moving average lines (red and blue lines). Note that they're close to a bearish crossunder. Something we haven't seen since February. That crossunder could be bearish, provided it leads to a move under the 50-day line.
But, what we're really interested in seeing is resistance at the 10- and/or 20-day lines. They're both around 1515 (or will be by Monday). If they can keep the index held down for a day or so, that may be just long enough to say there's no point to stay in stocks right now. Be sure to keep a close eye on that level early next week.
S&P 500 Chart

Dow Jones Industrial Average
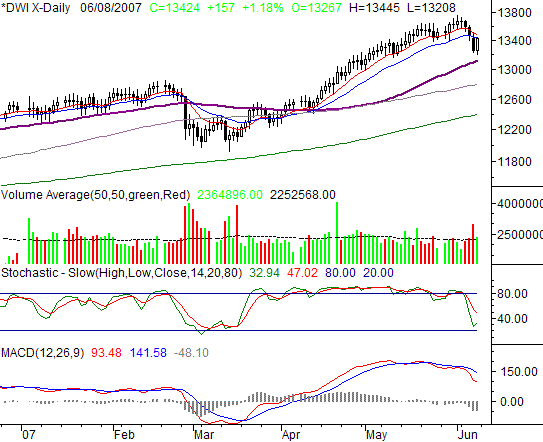
The Dow Jones Industrial Average gained 1.18% on Friday, a 157 point move that left the blue chip index at 13,424. For the week, the index still lost ground, 244 points, or 1.79%.
The higher you fly, the farther you fall. The Dow verified it last week, at least partially.
Remember the ongoing checkup we were doing with how far the Dow was above its 200-day moving average line (green)? In general, we suggested anything more than 7% above or below the 200-day average was too much, and a reversal was possibly in the works. On June 4, the Dow was 7.2% above it -- a problem that had been in place for a few too many days. Now it's only 4.9% above the 200-day line. That may be enough to release the pent-up pressure, which lends itself to the "bullish again" argument.
What we're waiting for here is much like what we're waiting for with the SPX -- what happens with the 10/20-day lines and the 50-day line at 13,117. The 20-day line (blue) at 13,447 capped the rally on Friday, but may have to fend off another attack early this coming week. The picture is actually pretty simple -- a cross back above the 10-day line is likely to restart the uptrend, while a cross under the 50-day line may really start the next leg of selling. If so, a revisit to 12,600 isn't out of the question.
Dow Jones Industrial Average Chart

Price Headley is the founder and chief analyst of BigTrends.com.
|