| Measuring Implications of Trendlines |
| By Andy Swan |
Published
06/13/2007
|
Stocks
|
Unrated
|
|
|
|
Measuring Implications of Trendlines
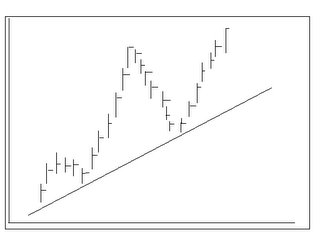
Traders often use trendlines to help determine price objectives. The rule being: once a trendline is broken, the prices can be expected to move the same distance in the opposite direction as the prices achieved on the other side of the trendline before the trend reversal. This rule is true for day trading, swing trading and options trading.
More simply, if our uptrend trade on GOOG moved $100 above the trendline, we can expect GOOG to drop $100 below the trendline when it is broken. This measuring rule for the trendline is similar to the price pattern rule used in the well-known and often used head and shoulders reversal pattern where the distance from the "head" to the "neckline" is projected beyond that line once the line is broken.
Correctly Drawn Trendlines
Although some traders draw the trendline just under the closing prices, the most common use of the trendline includes covering the complete day’s price range. Yes, to those who are day trading, swing trading, and trading options, the closing price may be the most important price of the day, but it is only a small sampling of the day’s activity.

Andy Swan is co-founder and head trader for DaytradeTeam.com. To get all of Andy's day trading, swing trading, and options trading alerts in real time, subscribe to a one-week, all-inclusive trial membership to DaytradeTeam by clicking here.
|