| A Mid-Week Look at the Market |
| By Price Headley |
Published
06/14/2007
|
Stocks
|
Unrated
|
|
|
|
A Mid-Week Look at the Market
Wednesday's bounce was big, but so was Tuesday's dip. Most indices are up for the week, but we remain a little hesitant to jump on the bandwagon. Besides, it's expiration week, and it's kind of difficult to distinguish between expiration-related forces and the market's own organic ebb and flow. Though we still don't have any concrete answers for you, we do have some more things to look out for through the end of this week and the beginning of the next one.
NASDAQ Composite
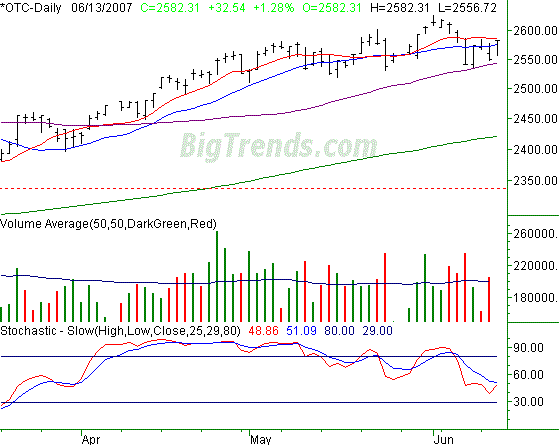
Some action on Wednesday, huh? The NASDAQ rallied by 32.54 points, or +1.28%, to end the day at 2585.31. For the week so far, it's now up 0.34%, or 8.77 points. However -- and seemingly despite the odds -- we actually do think the OTC has a fighting chance of staging a breakout move after Wednesday. Simultaneously, the bearish argument could be justified as well, with just a very minor move.
Like we said above, "caught between a rock and a hard place" may be the most fitting description of the current scenario. The retest of the 50-day line (purple) sparked a bounce last week. However, after Wednesday, we've seen two retests of the 10-day line (red), each of which has halted the bullish advance. The former is currently at 2544, while the latter is at 2585. The composite has used every bit of that 41 point range over the last five sessions, but not one bit more. We suspect whichever one breaks first will be the loser, allowing the index to keep on moving in that direction.
NASDAQ Composite Chart

S&P 500
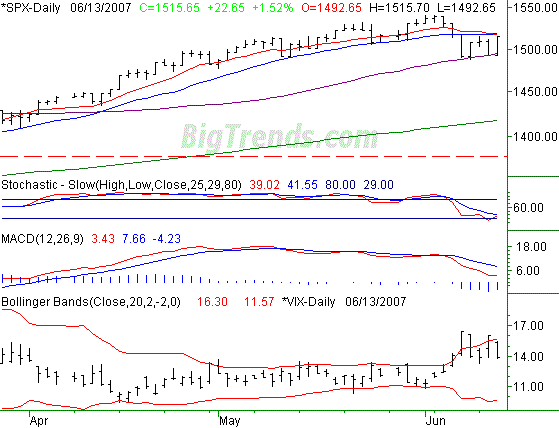
Everything we said about the NASDAQ and its 10- and 50-day moving average lines? Ditto for the S&P 500. The 50-day line is at 1495, while the upper line is at 1517. Watch for a break of either, as it could be an omen of things to come.
That being said, the SPX chart has done something we haven't seen since February - the 10-day line crossed under the 20-day line (blue) today. This is significant, as it points to the true intermediate-term trend. We still need to see a close under the 50-day average to act as a confirmation of the crossunder signal, so we're effectively back to square one.
The VIX is getting real interesting too. Technically speaking, we see it moving upward more than moving lower, which has bearish implications. However, as of Wednesday, the VIX might have a chance at pushing lower, thanks to the room created by last week's big rise. The lower band line is at 11.57, versus the VIX's close of 14.73. A close under last week's low of 14.24 will be a confirming bullish signal.
S&P 500 Chart

Dow Jones Industrial Average
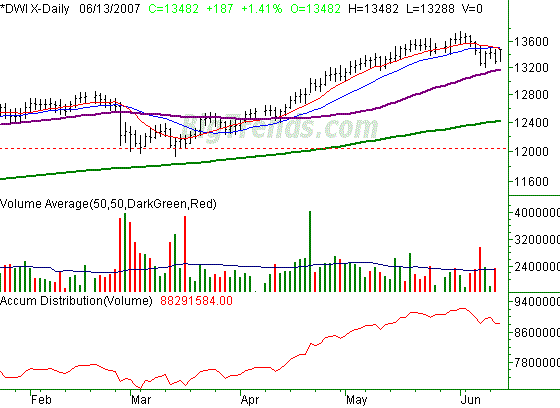
Wednesday's close of 13,482 was the result of the Dow's 187 point gain, or 1.41% rally. On a weekly basis, the DJIA is now ahead of last Friday's close by 58 points, or 0.42%.
At the risk of being a little repetitive, the Dow also is still struggling with its 10- and 20-day lines. In fact, the 10-day average crossed under the 20-day average on this chart too -- not really the best of signs, though we don't want to rehash that here.
One thing we do want to highlight though (and one of the key reasons we're still thinking more bearishly than bullishly) is the accumulation-distribution line. It's pointed lower for a reason. The selling has been heavy, and the buying has been light. One day like Wednesday doesn't change that generality. Maybe we're the proverbial perma-bear, and overly-pessimistic. We just have to think the buyers are becoming exhausted, and the calendar will eventually catch up with stocks.
On the other hand, the market has managed to defy gravity for the better part of the past few months. We'd like to say we'll have clarity soon. but being expiration week, we really may not. Stay tuned.
Dow Jones Industrial Average Chart

Price Headley is the founder and chief analyst of BigTrends.com.
|