Yesterday we looked at a market bias from the 1990's that doesn't work too well today. Here's something that is currently persisting. Again, it's really simple. Put away your calculator.
If the average 2-day close is less than the average 5-day close, then buy the next day on the opening. If the average 2-day close is greater than the average 5-day close, then sell short the next day on the opening. Exit all positions on the close.

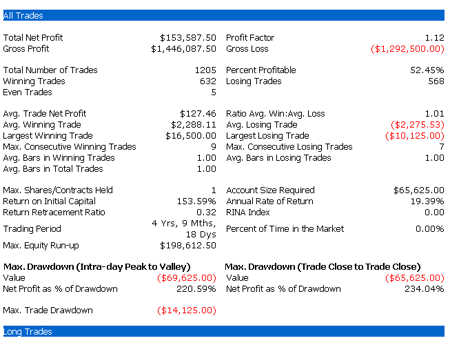
Figure 1 shows a five-year performance summary for a full-sized S&P contract. We're seeking theoretical biases to serve as a future system component, so at this time, we're not concerned with slippage/commission. We acknowledge we can't trade this, but let's consider the following:
There is a 52.45 percent profitability, which isn't shabby in a field of 1,200 trials. (I know, you can get 80 percent return according some ads, but we're not charlatans here). The percentage will become more significant as we demonstrate robustness via similar results in other markets. There is also a decent net profit and an okay average net per trade ($127.46).

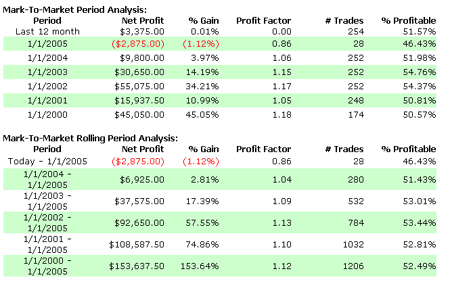
Figure 2 gives us further fortification. Consistent with a key optimization rule, the profits are distributed evenly throughout the data field. Every completed year is a winner.

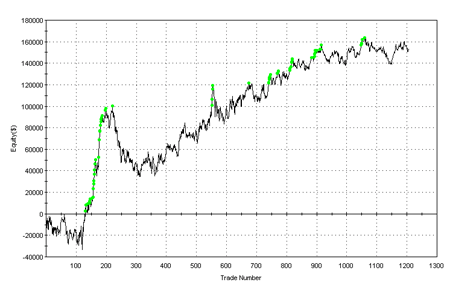
Figure 3 shows a consistently upward sloping equity line.
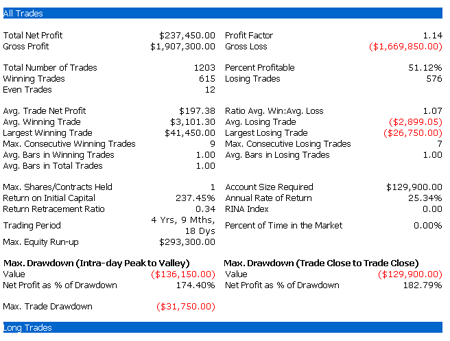
The related full-sized Nasdaqs produce similar results. $237,450 total net profit. 51.12 percent return. $197.38 profit per trade. So far, so good.

The following table shows performances in the additional major financials that we'll be regularly tracking in this column.
| Net Profit | Trades | % Profit | Ave. Trade |
| FULL-SIZED RUSSELL | $ 59,000.00 | 1204 | 50.1 | $ 49.00 |
| 30 YEAR BOND | $ 45,625.00 | 1199 | 50.63 | $ 38.05 |
| 10 YEAR NOTE | $ 27,734.00 | 1199 | 50.54 | $ 23.13 |
| 5 YEAR NOTE | $ 17,109.00 | 1200 | 49.5 | $ 14.26 |
| JAPANESE YEN | $ 9,150.00 | 1200 | 48.08 | $ 7.63 |
| EURO CURRENCY | $ 27,400.00 | 1198 | 52.42 | $ 22.87 |
| SWISS FRANC | $ 13,375.00 | 1200 | 50.67 | $ 11.15 |
Art Collins is the author of Market Beaters, a collection of interviews with renowned mechanical traders. He is currently working on a second volume. E-mail Art at artcollins@ameritech.net.