Professional trader Price Headley provides a look at the stock market for the week of June 18.
For a few weeks now, we've been evenly staring at both bullish and bearish possibilities. And, up until Friday, the markets had complied by being pretty much where they were in mid-May. It may come as no surprise then that we don't necessarily have any more answers today. We do, however, still have plenty to look for in our search for the elusive sign of what's to come. By the way, we've switched to candlestick charts today to fully illustrate the kinds of pressure we're seeing.
NASDAQ Composite
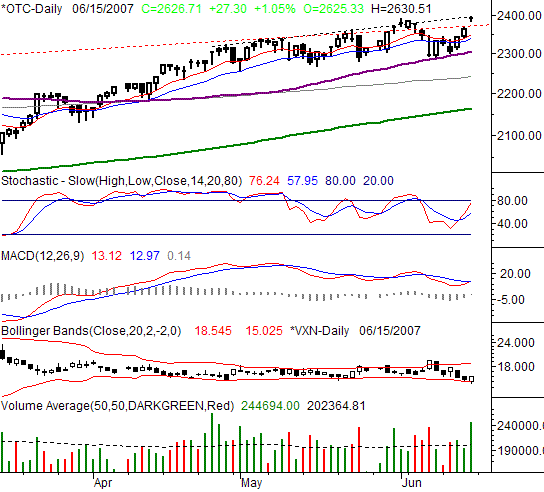
The NASDAQ gained 1.05% on Friday, or 27.3 points, to end the session at 2626.71. For the week, it gained 53.17 points, or 2.07%. Great news, if it weren't for one thing -- a huge gap. If it's closed, we have to wonder if it could also jump-start a significant pullback.
First and foremost, we want to look at Friday's bar - the shape and placement of it specifically. There's a gap between Thursday's high of 2604.76 and Friday's low of 2620.72. And, Friday's overall range from 2620.72 to 2630.51 is very short from top to bottom, at least relative to the other bars. Plus, the close is very close to the opening price.
The pending pattern is called a 'bearish evening doji star', though Friday's bar itself is called a hanging man. And we stress pending because the shape may mean nothing just yet. What it could mean, however, is something very bearish.
The doji star - especially a gapping doji - is often a sign of a reversal. It indicates one final, big push, but one that's made by an exhausted army of bulls. And, following a huge March-thru-June rally, the bulls have every right to be tired. However, the pattern will only be complete (and meaningful) if we have a bearish bar on Monday that's basically a mirror image of Thursday's bar, meaning we see a bearish gap, and then a strong move lower from the open. Otherwise, it's all academic. It's just something well worth mentioning.
Aside from the doji itself, we can also see Friday's high ran right up into a short-term resistance line (dark, dashed) -- another bearish worry.
Oh yeah - the VXN. At the lower Bollinger band right now, it doesn't have a lot of room to move any lower, though it could move higher pretty easily - another bearish argument. (Last week was option expiration week though, so we don't want to put too much weight on that tool just yet.)
Either way, whether the NASDAQ is still in bullish mode or ready to turn bearish, we're not exactly thrilled with the gap - it needs to be closed first if any further uptrend is to have a good short at staying alive. Or, it may be the beginning of the end, so to speak. The 50-day line (purple) at 2550 is going to be our ultimate bearish signal line.
For those who are keeping score, the NASDAQ is now 8.2% above its 200-day moving average line (green). It hasn't been able to separate itself any further than that with this current rally.
NASDAQ Composite Chart - Daily 
S&P 500
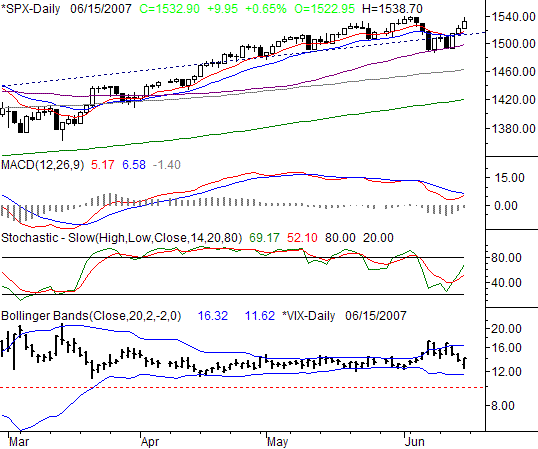
Friday's 0.65% for the S&P 500 - a 9.95 point gain - pushed it up to 1532.90 by the time the closing bell rang. That was 25.25 points higher (+1.67%) than the prior week's close. The overall, bottom-line move was obviously bullish, but the staying power waned as the week wore on, which is not something we can entirely blame on option expiration.
Specifically, take a look at the daily closes relative to the daily highs over the last three days of the week. Three higher high, and three higher closes. But, each close was further away from the daily high, meaning the market wasn't able to hang on to a lot of its intra-day gain -- a condition that worsened as time went on. Maybe it's nothing, maybe it's something.
In the meantime, if we were looking at anything besides the chart (i.e. the technical indicators), we'd actually have to be bullish. The 10-day line (red) is back above the 20-day line, and the stochastic lines are bullish. Moreover, we're probably on the verge of a MACD crossover.
The VIX? As we mentioned, last week's option expiration is likely to be skewing any options-related indicator, but it still doesn't change the fact that it ended last week pointed higher, after traveling lower for four days. That has more bearish implications than bullish ones, but we can't be too concerned about them until we see how things take shape this coming week.
In the meantime, don't think we haven't noticed that Friday's high of 1538.70 was just a hair under the recent peak of 1540.55. That's the line in the sand; a close above it may be a bullish spark. However, based on last week's hesitation, the closer we got to that mark, the more shy the bulls got. On the flipside, we're still using the 50-day line (purple) at 1498 as our bear signal.
S&P 500 Chart - Daily 
Dow Jones Industrial Average
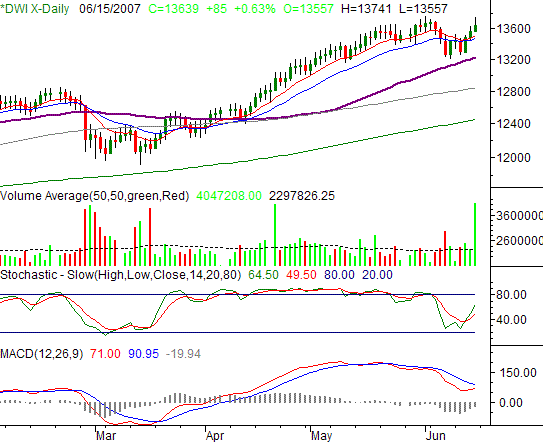
After an 85 point gain on Friday, or +0.63%, the Dow Jones Industrial Average closed out at 13,639. For the week, it gained 1.60%, or 215 points. The net results were strong, but the progressive shape of the bars (like the SPX's) is something of a red flag. Each close during the last half of the week was further away from the high, even though gains were being made.
In terms of what we're looking for, the Dow's chart looks quite a bit like the S&P 500's. So, we're looking for the same thing - a close above the recent high of 13.757 would be bullish. Or, a close under the 50-day line at 13,223 would be bearish.
Just FYI - the Dow is now 9.6% above its 200-day line, which isn't the biggest disparity we've seen lately, but definitely pushing its limits.
Dow Jones Industrial Average Chart - Daily 
Price Headley is the founder and chief analyst of BigTrends.com.