| The McMillan Options Strategist Weekly |
| By Lawrence G. McMillan |
Published
06/22/2007
|
Options
|
Unrated
|
|
|
|
The McMillan Options Strategist Weekly
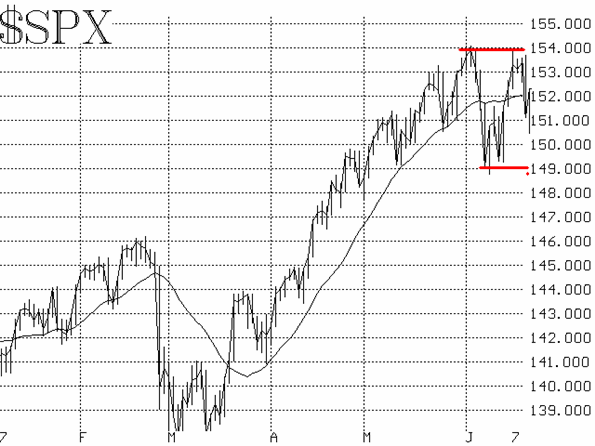
The stock market remains very volatile, within what is now developing as a trading range. Clearly the top of the range is 1535-1540, which $SPX has probed at least 7 times in the past month -- without being able to punch on through. There is some debate as to where the bottom of the range is, but it's somewhere between 1490 (the early June lows) and 1505 (today's low). In either case, both bulls and bears have thought they had upper hand, only to see the market reverse and head the other way. This back-and-forth action increases actual (statistical) volatility, without really giving any particular market direction. Since the trading range is so wide, there is enough room to trade within it. Eventually, a breakout will occur -- either above 1540 or below 1490 -- and then a more trending environment may unfold.

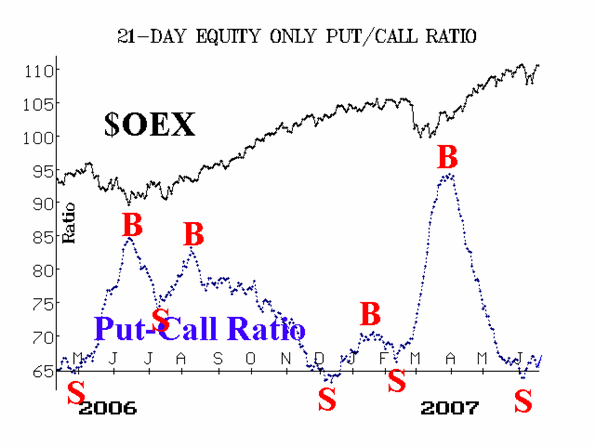
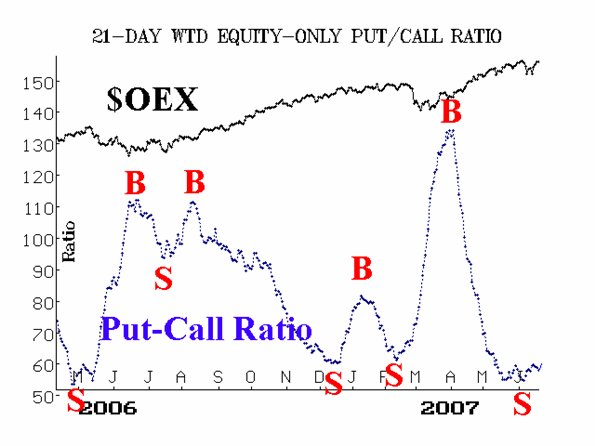
The equity-only put-call ratios are designed to be intermediate-term indicators. They have been low on their charts for some time, indicating that they are in overbought territory. There have been a couple of sell signals (see figures 2 and 3), but the averages continue to "wiggle" at low levels, as the market flips back and forth. But unless these ratios break down to new lows (which is a possibility, of course) we will continue to view them as bearish. In the bigger picture, they are telling us that a huge number of call options (versus put options) has been traded (purchased?) and this is a generally dangerous situation for the intermediate-term health of the broad stock market.


Market breadth (advances minus declines) reached overbought levels again this week, as $SPX approached the 1540 area. Then, when the market fell sharply on Wednesday, new sell signals were generated by the breadth oscillators. Despite the market advance today (Thursday), breadth was only modestly positive. Hence these indicators -- which we prefer to view only as confirming indicators -- are bearish.
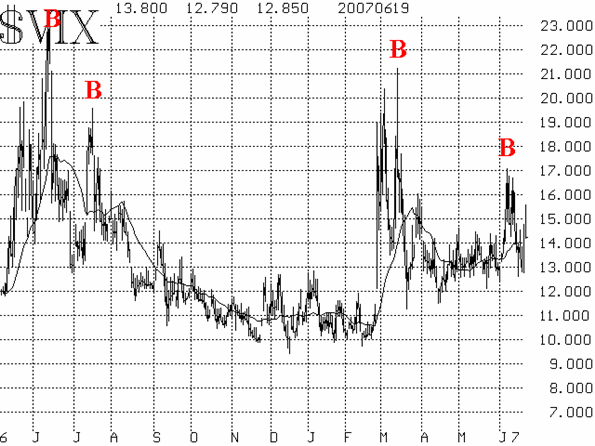
Finally, there are the volatility indices ($VIX and $VXO). Early in the week, $VIX fell back below 14, completing a buy signal (see Figure 4). That buy signal may have trouble sustaining itself, though, as $VIX jumped higher yesterday and remains above 14 today. A new uptrend in $VIX would be regarded as bearish. The volatility futures are all trading at a premium to $VIX, and that is a mildly bearish sign as long as $VIX is rising. Also, since the actual volatility of $SPX has increased -- due to volatile movements in both directions -- $VIX should naturally trade at somewhat higher levels, just to keep pace.

In summary, the indicators are a bit mixed, as you might expect since the market is in a volatile trading range. Breadth and $VIX flip back and forth quickly as the market makes each volatile move. Even the more intermediate-term equity-only ratios have had trouble sustaining a signal. This is rather unnerving, but is probably to be expected during a trading range.
Lawrence G. McMillan is the author of two best selling books on options, including Options as a Strategic Investment, recognized as essential resources for any serious option trader's library.
|