| Weekly Outlook in the Stock Market |
| By Price Headley |
Published
06/25/2007
|
Stocks
|
Unrated
|
|
|
|
Weekly Outlook in the Stock Market
NASDAQ Composite Commentary
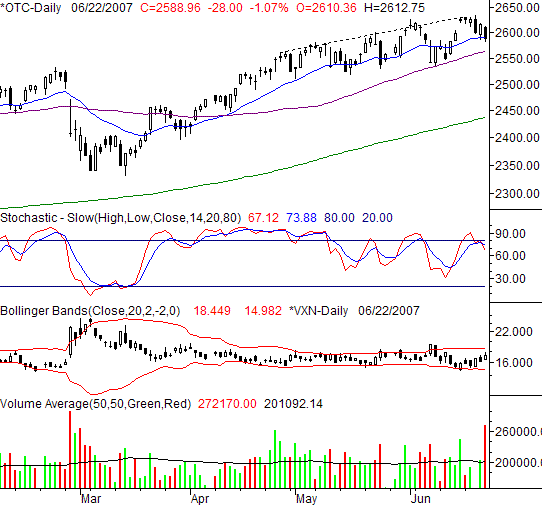
The NASDAQ’s close of 2588.96 was the result of a 28 point dip on Friday, a 1.07% selloff. For the week, the OTC lost 37.75 points, or -1.44%.
How did the NASDAQ crack into new multi-tear highs (again), and then turn right around and sink (again)? Take a look at the dashed resistance line that’s now come into play. More importantly, keep it in mind if we go through this again.
In the meantime, the NASDAQ closed back under the 20-day line. Normally that would be short-term bearish, but this time – not a major concern. Why? We’ve seen it three times in the last two months, and none of those crossunders meant anything.
The key here is the 50-day line (purple), something we’ll be saying again about the Dow below. It’s at 2564 right now, and as you can see, played a big support role two weeks ago. We’ll wait to see if it breaks down this time before getting too worried about a bigger pullback (though we are due).
In the same light, we’re also going to be watching the CBOE NASDAQ Volatility Index (or VXN). The VXN closed at 17.29 on Friday, pointed higher after bouncing off of its lower Bollinger band two weeks ago. That’s bearish, but like the NASDAQ’s dips under the 20-day line, we’ve seen it before. The upper Bollinger band, at 18.45, may end up being a cap again. We really need to see what happens there before we jump to any conclusions, though the current momentum is bearish again.
NASDAQ Composite Chart - Daily

S&P 500
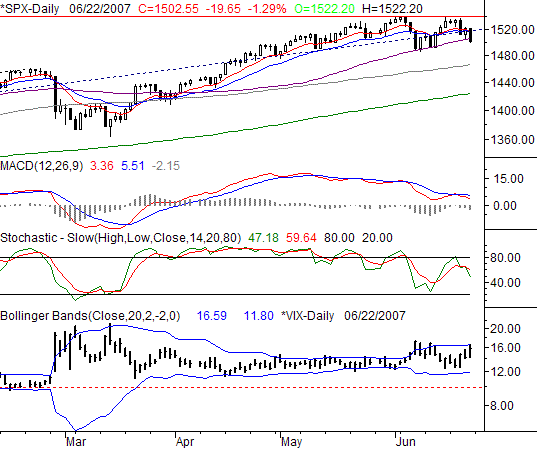
On Friday, the S&P 500 pulled back by 19.65 points, or -1.29%. The weekly close of 1502.55 was 1.98% under the prior week’s close (-30.35 points).
After hitting a second top around 1540 two weeks ago, the S&P 500 sank again. This time though, a key intermediate-term support line was breached – the 50-day line (purple). That’s a worry. Considering it’s the first time we’ve seen it since the horrendous pullback we suffered in late February. We’d like to see a lower close just to serve as a confirmation though.
As for other indicators (like stochastics and MACD), they’re already bearish.
The real curiosity here is the VIX. It rose pretty sharply the last four days of last week, which is bearish for stocks. However, it was also halted at the upper Bollinger band, at 16.59. More often than not recently, the market (and the VIX) has been more apt to reverse than follow through, and we have to wonder if we’re hitting a ceiling now. Only time will really tell though.
S&P 500 Chart - Daily

Dow Jones Industrial Average
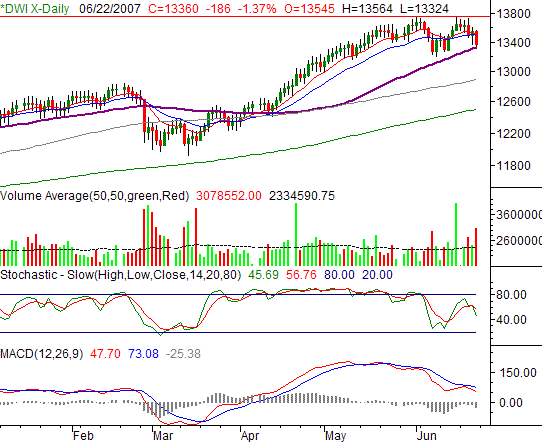
The Dow Jones Industrial Average gave up 1.37% on Friday, losing 186 points. On a weekly basis, the blue chip index fell by 279 points, or 2.05%. It was the biggest percentage loss for all the major indices.
A couple of observations about the Dow. First and foremost, note the potential double-top around 13,750. The Dow took a second stab at new highs two weeks ago, and failed to do anything with it – again. Instead, the Dow fell sharply again.
The second thing – note the heavy volume behind the selling. The red volume bars are getting taller, and they were pretty tall to begin with.
Besides that, the stochastics and MACD lines are both bearish at this point.
The issue with the Dow is the 50-day line (purple). It’s at 13,321, where the Dow’s low on Friday was 13,324. If it breaks as support, then we’ll put more weight into all the other bearish hints here. If it instead finds support and revives the overall uptrend, then we’ll be eyeing the potential resistance around 13,750.
Dow Jones Industrial Average Chart - Daily

Price Headley is the founder and chief analyst of BigTrends.com.
|