| Targeting USD/CAD for Hedging |
| By Antonio Sousa |
Published
06/27/2007
|
Currency
|
Unrated
|
|
|
|
Targeting USD/CAD for Hedging
Currency Pair: USDCAD
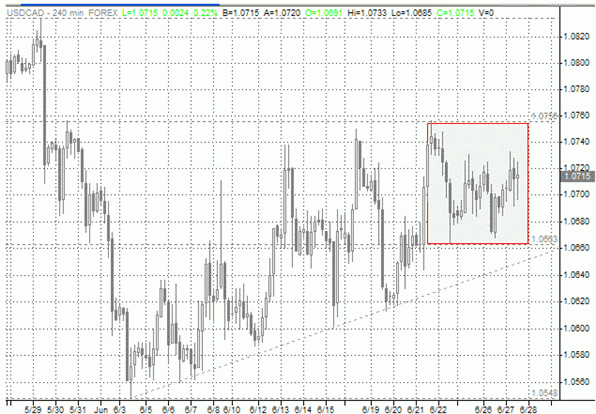
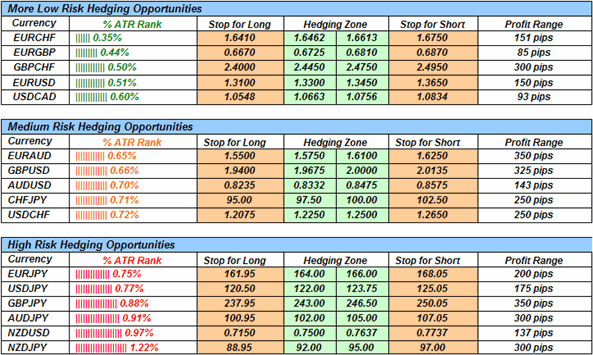
Entry Zone: Go both long and short at the market if the price is at any level within the 1.0663 – 1.0756 range
Protective Stop: Long stop below 1.0548 and short stop above 1.0834
Profit Target: Long Target at 1.0756 and Short Target at 1.0663
Profit Potential: 93 pips ( excluding transaction costs and slippage )
The USD/CAD is our primary target for hedging in the week ahead, with clear range-bound trade and concrete support and resistance levels. To hedge, go both long and short at the market if price stays within the above Hedging Zone. Take profits at R1 for longs and at S1 for shorts, covering losses above R2 or below S2.


Rules for the Hedging Radar
1) Entry Zone -> Go both long and short at the market if the currency is at any level within the Hedging Zone.
2) Profit Taking ->Target for the long order is the top of the entry zone, for the short order is the bottom of the entry zone.
3) Stop Levels are Key Support and Resistance Points -> Place the actual stops a few pips above the higher level and a few pips below the lower level. The break of these levels signals that the ranges have been broken and the hedging strategy should no longer be implemented.
4) The lower the Average True Range, the Less Risky the Currency is for Hedging.
How is the % ATR Rank Calculated?
The average true range is the 90 days moving average of the currency’s true range. The true range is the greatest of: the difference between the current high and the current low; the difference between the current high and the previous close or the difference between the current low and the previous close.
The %ATR is the relative value of the ATR when weighted against the price. For example, if the ATR for the EURGBP is 26 pips then the %ATR is 0.4 percent since 0.0026/0.6602 = 0.4% where 0.6602 is the quoted price of the EURGBP.
Antonio Sousa is a Currency Analyst for FXCM.
|