Lawrence G. McMillan reviews the options market in his weekly column for June 29.
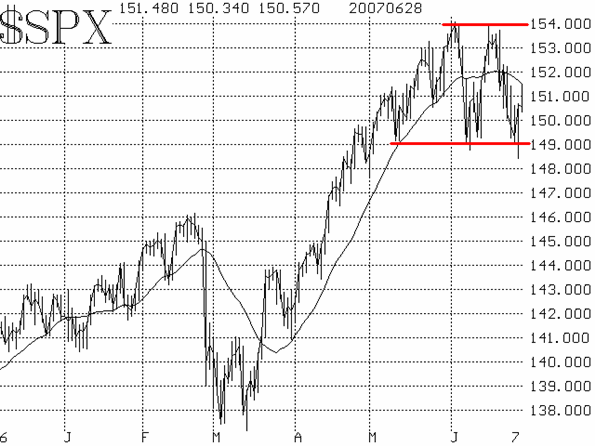
The S&P 500 Index ($SPX) has clearly carved out a trading range on its chart. There was heavy resistance in the 1535-1540 area a couple of weeks ago. When that couldn't be penetrated, the market fell rather sharply, eventually bouncing off the 1485-1490 area a couple of times making that a support area. Until proven otherwise, traders can utilize this information -- buying near support and selling near resistance. Eventually, the market will break out one way or the other, but until it does, there is plenty of room within this trading range to take advantage of it. 
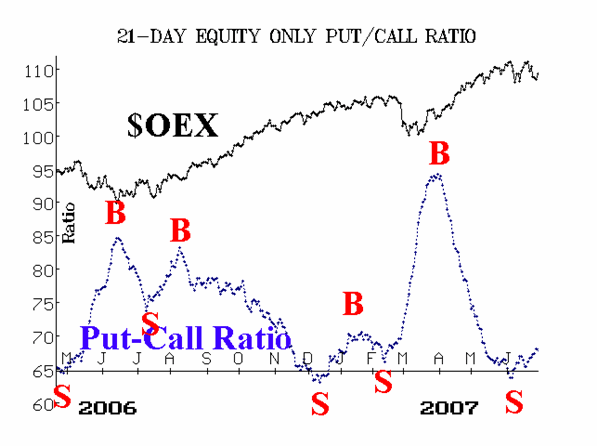
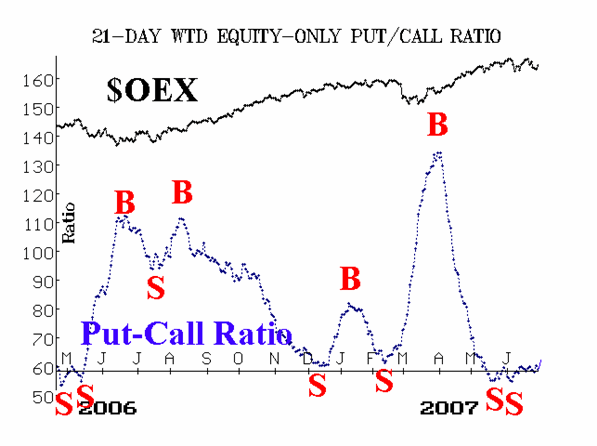
The equity-only put-call ratios remain on sell signals (see Figures 2 & 3). These intermediate-term indicators are the most bearish in our set of indicators. For this reason, we are thinking the eventual breakout will be on the downside, unless these put-call ratios improve. For now, they are rising from low (extremely overbought) levels, which means they are on strong sell signals. 

Market breadth (advances minus declines) has been rather negative as well. When the market fell last week, breadth was extremely poor for several days. This produced an oversold condition in breadth oscillators.
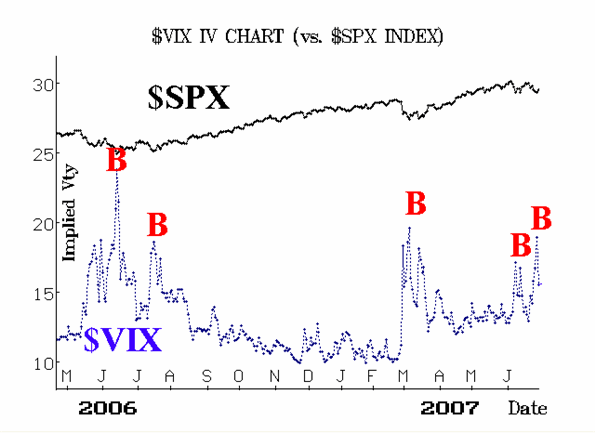
Volatility indices ($VIX and $VXO) have been extremely volatile as well. They broke out to the upside when the market fell, thereby establishing an uptrend. That was bearish, in our opinion. However, $VIX got a bit ahead of itself, reaching nearly 19 on Tuesday, before collapsing below 16 on Wednesday. That is enough of a reversal to qualify as a spike peak buy signal in $VIX. Those typically are quite reliable buy signals as well. 
So, the indicators are at odds with each other to a certain extent. The $SPX chart is neutral within the trading range. The equity-only put-call ratios are bearish. Volatility has given a spike peak buy signal, and the breadth oscillators are somewhat positive -- having moved from deeply oversold to a more neutral status. This is the kind of mixed picture that one can expect to find when the market is trading within a range. So, this is not unusual to see.
Lawrence G. McMillan is the author of two best selling books on options, including Options as a Strategic Investment, recognized as essential resources for any serious option trader's library.